
Figures & data
Table 1. Distributions of spherical equivalent M before and after cycloplegia, stratified by age and gender
Table 2. Distributions of J0 before and after cycloplegia, stratified by age and gender
Table 3. Distributions of J45 before and after cycloplegia, stratified by age and gender
short-legendFigure 1. 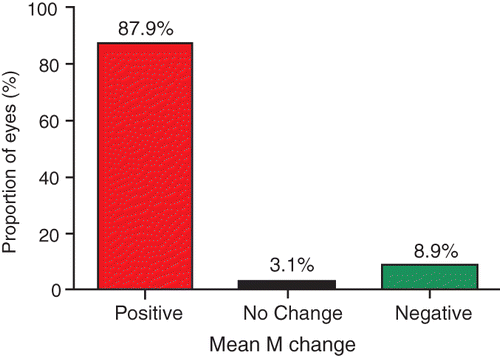
short-legendFigure 2. 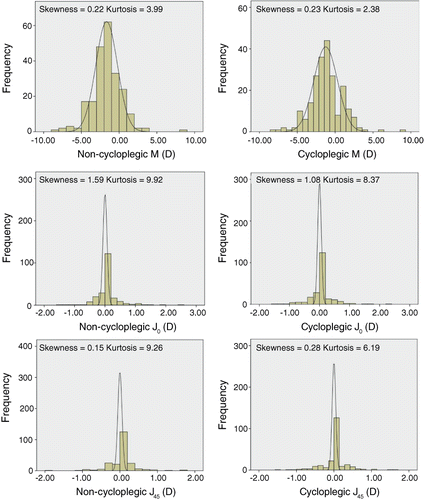
short-legendFigure 3. 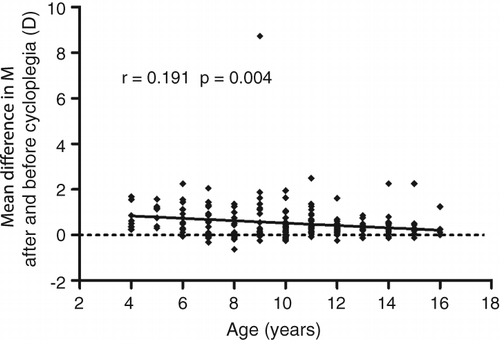
short-legendFigure 4. 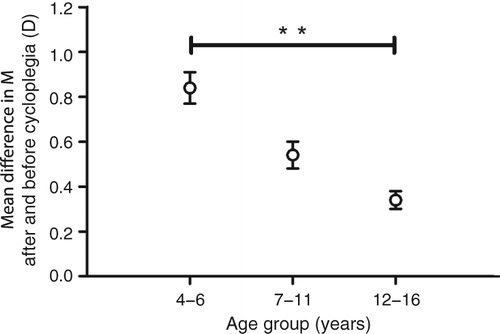
Table 4. Proportion of spherical equivalent M before and after cycloplegia