Figures & data
Table 1 Physical and chemical properties of the soil medium
Figure 1 Shoot fresh weight of (a) non-inoculated plants and (b) inoculated plants at each harvest time. Bars represent standard deviations of the means of three replicates. Peat addition rate: 0% (–⧫–), 2.5% (–▪–), 5% (–▴–), 10% (--×--), 15% (–×–) and 20% (–•–) (w/w).
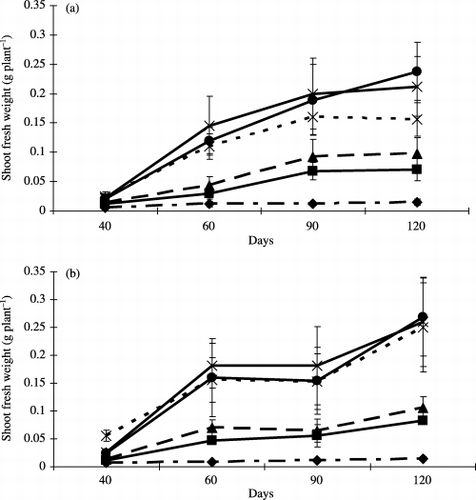
Figure 2 Total root length of inoculated plants. Bars represent standard deviations of the means of three replicates. Differences among the levels of peat addition were determined using an anova (P = 0.58, 0.04, 0.036 and 0.16 at 40, 60, 90 and 120 days, respectively). Peat addition rate: 0% (–⧫–), 2.5% (–▪–), 5% (–▴–), 10% (--×--), 15% (–×–) and 20% (–•–) (w/w).
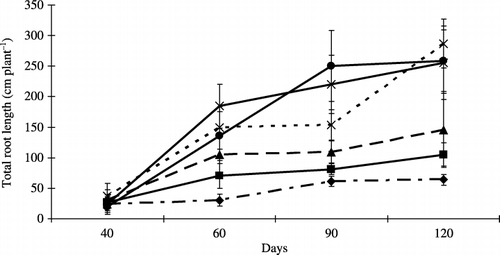
Figure 3 Root colonization at each harvest time. Bars represent standard deviations of the means of three replicates. Differences among the levels of peat addition were determined using an anova (P = 0.03, 0.001, 0.001 and 0.001 at 40, 60, 90 and 120 days, respectively). Peat addition rate: 0% (–⧫–), 2.5% (–▪–), 5% (–▴–), 10% (--×--), 15% (–×–) and 20% (–•–) (w/w).
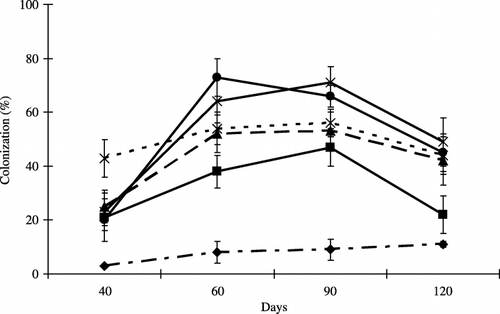
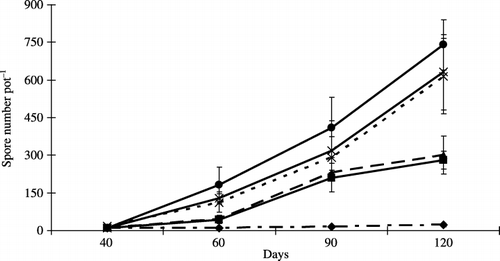
Figure 4 Spore number per pot at each harvest time. Bars represent standard deviations of the means of three replicates. The differences among the levels of peat addition were determined using an anova (P = 0.01, 0.001, 0.04 and 0.001 at 40, 60, 90 and 120 days, respectively). Peat addition rate: 0% (–⧫–), 2.5% (–▪–), 5% (–▴–), 10% (--×--), 15% (–×–) and 20% (–•–) (w/w).