Figures & data
Figure 1 Visible spectra of chloroform-extractable fraction in chloroform from (a) Andosol (Sugadaira-G [SGG]) and (b) Cambisol (Kuroiwa [KI]) profiles.
![Figure 1 Visible spectra of chloroform-extractable fraction in chloroform from (a) Andosol (Sugadaira-G [SGG]) and (b) Cambisol (Kuroiwa [KI]) profiles.](/cms/asset/0e7036db-991e-4ad1-b047-58593ab8da8c/tssp_a_10382377_o_f0001g.gif)
Table 1 Chloroform-extractable green fraction (CEGF) and Pg contents, soil chemical properties and properties of humic acids
Table 2 Values of E440CEGF/E454CEGF and E418CEGF/E454CEGF ratios calculated from the visible spectra of the chloroform-extractable fraction (CEF) from the Sugadaira-G (SGG) and Kuroiwa (KI) profiles
Figure 2 Vertical distribution of chloroform-extractable green fraction (CEGF) (•) and organic carbon (◊) contents in the soil profiles. (a) Sugadaira-G (SGG), (b) Sugadaira-F (SGF), (c) Soni (SN), (d) Gyosei (GS), (e) Kuroiwa (KI) and (f) Jiri-F (JR).
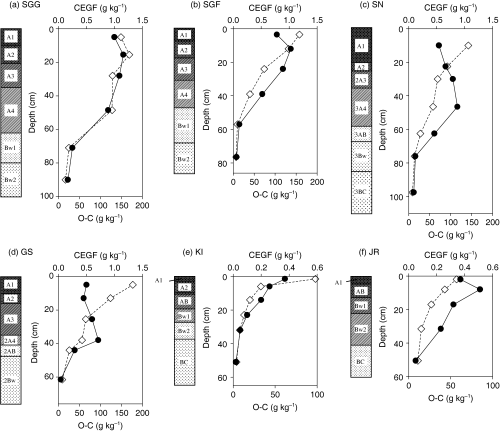
Figure 3 Relationship between the chloroform-extractable green fraction (CEGF) content and the contents of (a) Fed, (b) Ald, (c) Feo and (d) Alo. Parentheses indicate partial correlation coefficient excluding the influence of organic carbon (O-C). (–•–) all soil samples (n = 36); (–○–) soil samples with the highest content of CEGF in each soil profile (○, SGG [A2 horizon]; ▵, SGF [A2 horizon]; ◊, SN [3A4 horizon]; ▿, GS [2A4 horizon]; □, KI [A1 horizon]; , JR [AB horizon]). **P < 0.01; ***P < 0.001.
![Figure 3 Relationship between the chloroform-extractable green fraction (CEGF) content and the contents of (a) Fed, (b) Ald, (c) Feo and (d) Alo. Parentheses indicate partial correlation coefficient excluding the influence of organic carbon (O-C). (–•–) all soil samples (n = 36); (–○–) soil samples with the highest content of CEGF in each soil profile (○, SGG [A2 horizon]; ▵, SGF [A2 horizon]; ◊, SN [3A4 horizon]; ▿, GS [2A4 horizon]; □, KI [A1 horizon]; , JR [AB horizon]). **P < 0.01; ***P < 0.001.](/cms/asset/786951f7-769c-43b9-8511-86479695f52a/tssp_a_10382377_o_f0003g.gif)