715
Views
14
CrossRef citations to date
0
Altmetric
Original article

Phylogenetic distribution of bacteria isolated from the floodwater of a Japanese paddy field

, , , &
Pages 305-312 | Received 21 Feb 2005, Accepted 12 Jan 2006, Published online: 17 Dec 2010

Figures & data

Table 1 Phylogenetic distribution of 119 Gram-negative isolates at the family or genus level

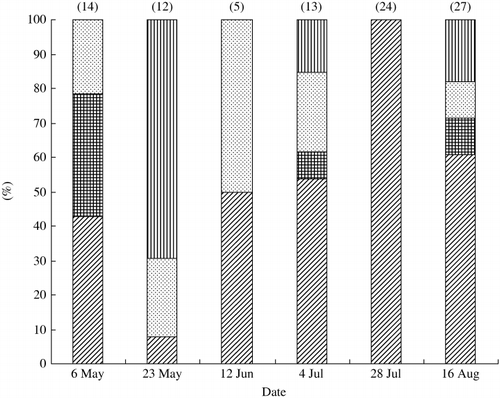
Figure 1  Seasonal changes in the composition of Gram-negative bacteria in floodwater during the rice cultivation period. Figures at the top of the columns indicate the number of Gram-negative bacteria examined for their 16S rDNA sequences. (

) α-Proteobacteria; (
) β-Proteobacteria; (
) γ-Proteobacteria; (
) Cytophaga–Flavobacterium–Bacteroides.

Figure 1  Seasonal changes in the composition of Gram-negative bacteria in floodwater during the rice cultivation period. Figures at the top of the columns indicate the number of Gram-negative bacteria examined for their 16S rDNA sequences. (Display full size) α-Proteobacteria; (Display full size) β-Proteobacteria; (Display full size) γ-Proteobacteria; (Display full size) Cytophaga–Flavobacterium–Bacteroides.

Table 2 Changes in the phylogenetic composition of bacterial isolates during the rice cultivation period

Figure 2  Phylogenetic relationships between Gram-negative isolates from floodwater and DNA clones obtained from various sites in paddy fields. (•) isolates (present study); CP, composting process of rice straw; FW, floodwater; MC, microcrustaceans; PW, percolating water; RS, rice straw; RR, rice roots. The scale bar represents 0.1 substitutions per nucleotide. Bootstrap values are shown at branch points when the values exceed 50%.
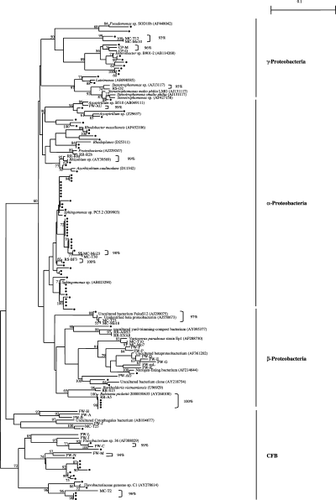
Figure 2  Phylogenetic relationships between Gram-negative isolates from floodwater and DNA clones obtained from various sites in paddy fields. (•) isolates (present study); CP, composting process of rice straw; FW, floodwater; MC, microcrustaceans; PW, percolating water; RS, rice straw; RR, rice roots. The scale bar represents 0.1 substitutions per nucleotide. Bootstrap values are shown at branch points when the values exceed 50%.

Reprints and Corporate Permissions

Please note: Selecting permissions does not provide access to the full text of the article, please see our help page How do I view content?

To request a reprint or corporate permissions for this article, please click on the relevant link below:

Academic Permissions

Please note: Selecting permissions does not provide access to the full text of the article, please see our help page How do I view content?

Obtain permissions instantly via Rightslink by clicking on the button below:

If you are unable to obtain permissions via Rightslink, please complete and submit this Permissions form. For more information, please visit our Permissions help page.