Figures & data
Table 1 Total C and N contents, cation exchange capacity and pH (H2O) in the soil
Table 2 Calendar of field management in the study paddy field in 2005
Figure 1 Seasonal variations in (a) temperature, (b) pH and (c) turbidity determined by absorbance at 660 nm wavelength in the floodwater samples in a plot without fertilizer (○), a plot with chemical fertilizers (□), a plot with chemical fertilizers and lime (⧫) and a plot amended with chemical fertilizers, lime and compost (▴) during the rice cultivation period. Shaded columns show the period of midseason drainage. Values are means ± standard deviation; n = 4.
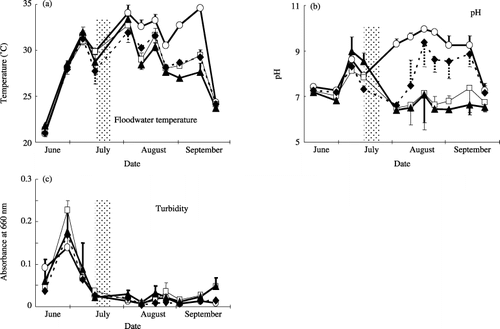
Figure 2 Comparison of viral counts using epifluorescence microscopy (EFM) and transmission electron microscopy (TEM). The line indicates the linear regression (EFM = 1.27 × TEM −13.80, R2 = 0.824).
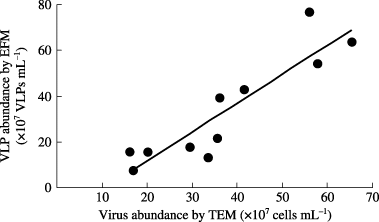
Figure 3 Seasonal variations in the abundance of (a) virus-like particles (VLPs) and (b) bacteria in the water samples in a plot without fertilizer (○), a plot with chemical fertilizers (□), a plot with chemical fertilizers and lime (⧫), a plot amended with chemical fertilizers, lime and compost (▴), and the irrigation water (★) during the rice cultivation period. Shaded columns show the period of midseason drainage. Values are means ± standard deviation; n = 4.
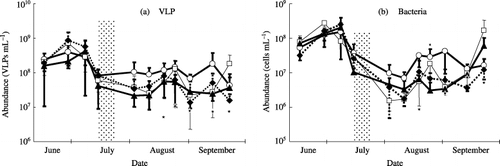
Figure 4 Relationships between (a) virus-like particles (VLPs) and (b) bacterial abundance and floodwater turbidity in a plot without fertilizer (○), a plot with chemical fertilizers (□), a plot with chemical fertilizers and lime (⧫) and a plot amended with chemical fertilizers, lime and compost (▴) during the rice cultivation period. Correlation coefficients were 0.688 (significant at the 1% level) between the abundance of VLPs and the floodwater turbidity and 0.691 (significant at the 1% level) between the abundance of bacteria and the floodwater turbidity.
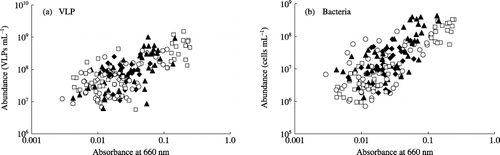
Figure 5 Percentage of planktonic virus-like particles (VLPs) in the total viral populations. The figure shows the average values with a half difference between duplication. (□), 15 June; (▓), 7 July; (▒), 2 August; (░), 18 August; (▀), 13 September. CF, plot with chemical fertilizers; CFCa, plot with chemical fertilizers and lime; CM, plot amended with chemical fertilizers, lime and compost; NF, plot without fertilizer.
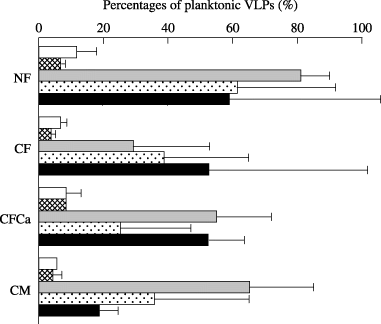
Figure 6 Seasonal variations in virus-to-bacterium ratios (VBRs) in the floodwater in a plot without fertilizer (○), a plot with chemical fertilizers (□), a plot with chemical fertilizers and lime (◊) and a plot amended with chemical fertilizers, lime and compost (▴) during the rice cultivation period. The correlation coefficient between the abundance of VLPs and bacteria was 0.608 (significant at the 1% level).
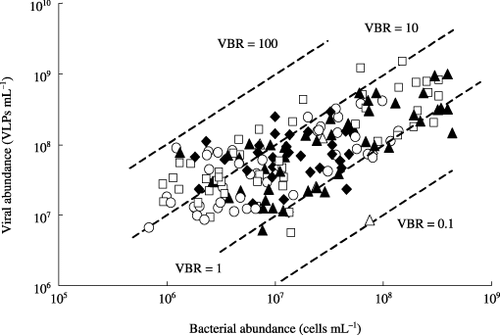
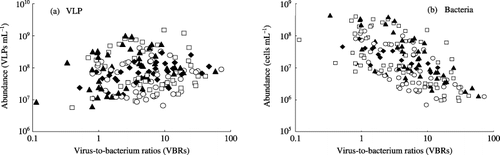
Figure 7 Relationships between virus-like particles (VLPs) and bacterial abundance and virus-to-bacterium ratios (VBRs) in the floodwater in a plot without fertilizer (○), a plot with chemical fertilizers (□), a plot with chemical fertilizers and lime (⧫) and a plot amended with chemical fertilizers, lime and compost (▴) during the rice cultivation period. The correlation coefficients were 0.041 (not significant) between VLPs and VBRs and −0.296 (significant at the 1% level) between bacteria and VBRs.