Figures & data
Figure 1 Schematic diagram of the plasmid constructs used in the transient assay (redrawn from Awazuhara et al. 2002a). P35S, the –830∼+13 region CaMV 35S RNA promoter; P35SEn, the –830∼–91 region of the CaMV 35S RNA promoter; Pβ, the –1046∼+18 region of the β subunit gene; GUS, β-glucuronidase Open Reading Frame (ORF); 3′, 3′ end of the α′ subunit gene of β-conglycinin (Adiputra and Anderson 1992).
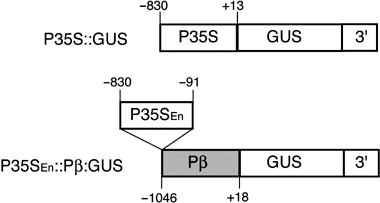
Figure 2 Effect of methionine (Met) application on the expression of the β subunit gene in the transient assay. Plasmids carrying P35S::GUS or P35SEn:Pβ::GUS were transfected to protoplasts prepared from wild-type Col-0 (WT,□) and mto1-1 mutant (□) plants. The 221-LUC + plasmid was co-transfected as an internal control. Protoplasts were cultured in media with or without 0.1 mmol L−1 of Met for 48 h after transfection. The GUS activity relative to the LUC activity was calculated and the values were recalculated relative to the value from wild-type protoplasts transfected with P35S::GUS cultured without Met. (a) Effects of Met application in the wild-type protoplasts. (b) Effects of the mto1-1 mutation. (c) Effects of Met application in the mto1-1 mutant protoplasts. Means and standard deviations of three replicates are shown. Asterisks in panels (a, c) indicate significant differences between treatments with and without Met (Student's t-test, P < 0.05).
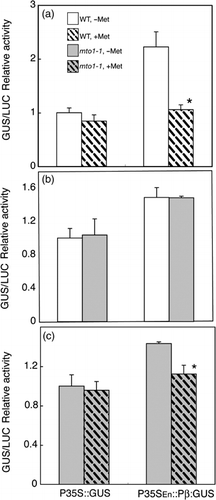
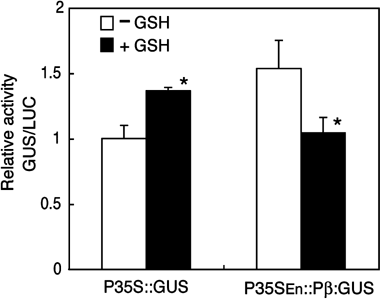
Figure 3 Effect of glutathione (GSH) application on the β subunit gene in the transient assay. Plasmids carrying P35S::GUS or P35SEn:Pβ::GUS were transfected to protoplasts prepared from wild-type (WT) plants. The 221-LUC + plasmid was co-transfected as an internal control. Protoplasts were cultured in medium with (▪) or without (□) 1 mmol L−1 GSH for 48 h after transfection. The GUS activity relative to the LUC activity was calculated for each sample. The values were recalculated relative to the value from protoplasts transfected with P35S::GUS and cultured without GSH. Means and standard deviations of three replicates are shown. Asterisks indicate significant difference between treatments with and without GSH (Student's t-test, P < 0.05).