Figures & data
Figure 1 Catchment of the Feitsui reservoir showing the three sampling locations.
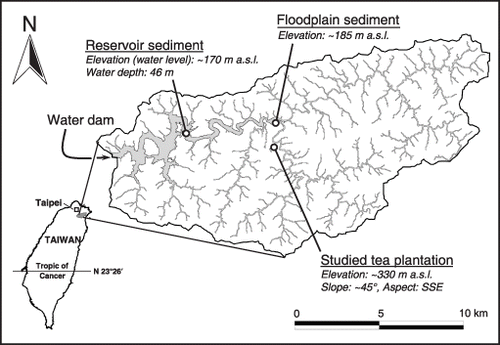
Figure 2 Cross-section of the studied tea plantation and total radionuclide inventories along the slope (n, number of replicate soil cores). Error bars represent standard deviation and the letters a, b and c indicate statistically significant differences (anova, Duncan's test, α = 0.05).
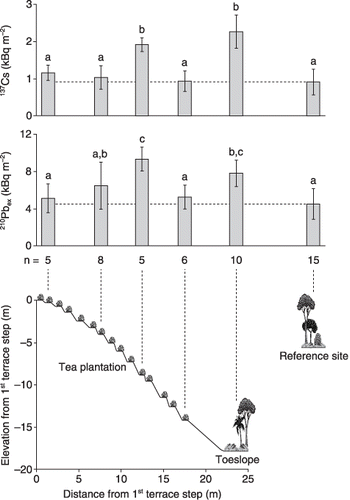
Figure 3 Depth distribution of 137Cs at different landscape positions, and 137Cs activity in the sediments. Error bars represent the standard deviation of three subsamples.
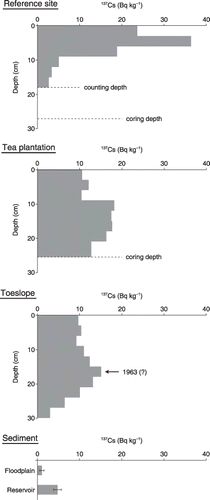
Figure 4 Depth distribution of 210Pbex at different landscape positions, and 210Pbex activity in the sediments. Error bars represent the standard deviation of three subsamples.
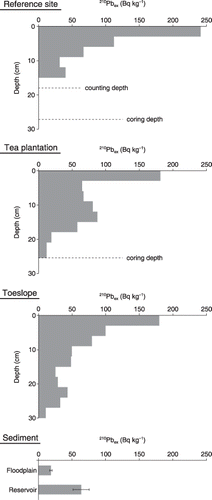
Table 1 Chemical and physical properties of the studied soils and sediments
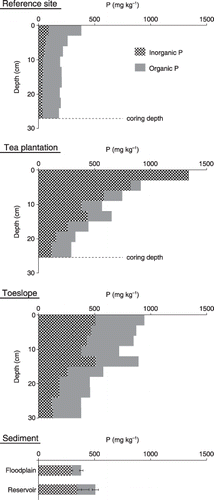
Figure 5 Depth distribution of inorganic and organic phosphorus (P) at different landscape positions, and P concentration in the sediments. Error bars represent the standard deviation of three subsamples.