Figures & data
Table 1 Composting methods, sources and constituents of the garbage compost used
Table 2 Design of the field experiment
Figure 1 Effect of garbage compost application on (a) plant density and (b) plant height of mock pak choy. Measurements were made 8 days (□) and 22 days (▪) after seeding. The treatments are described in Table 2.
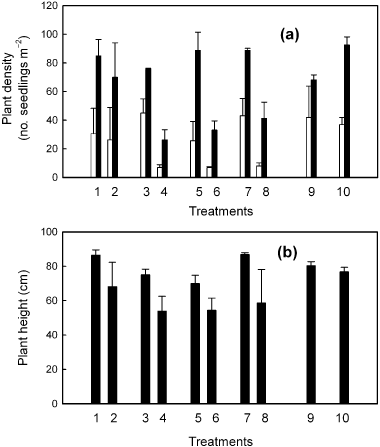
Figure 2 Relationship between the input of lipid contained in the garbage compost applied to the field and (a) plant density and (b) plant height of mock pak choy. The investigation was carried out 8 days (○) and 22 days (•) after seeding. The points show data from each treatment in the field experiment.
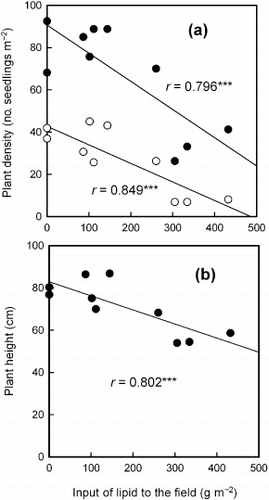
Table 3 Results of the multiple regression and errors between the predicted and actual lipid content or moisture in the garbage compost as determined by near infrared spectroscopy using second-derivative spectra in the short wavelength region (800–1100 nm)
Table 4 Results of the multiple regression and errors between the predicted and actual lipid content or moisture in the garbage compost as determined by near infrared spectroscopy using second-derivative spectra in the long wavelength region (1100–2500 nm)
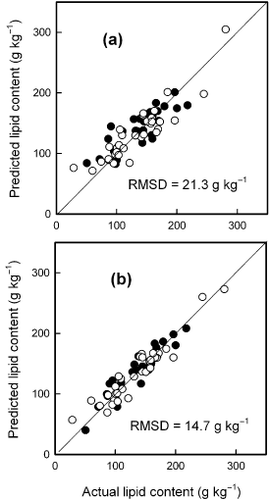
Figure 3 Values predicted by near infrared spectroscopy using the (a) short wavelength region (SWR) and (b) long wavelength region (LWR) versus the actual values of lipid content in the untreated garbage compost in the calibration (○) and prediction (•) sample sets. The solid line shows y = x. Wavelengths used: (a) 1040, 980, 802, 906 and 1020 nm; (b) 1762, 1802, 2270 and 1632 nm. RMSD, root mean square deviation.