Figures & data
Table 1 Electrical conductivity (EC) and osmotic potential of the stress treatment solutions
Figure 1 Effects of salt and alkali stresses on the ionic activities (IA) and free concentrations (FC) of macronutrients in the nutrient solutions (percentage is calculated according to the mean value of every treatment). (a) Ca2+, (b) Mg2+, (c), K+, (d) SO2− 4 and (e) NO− 3.
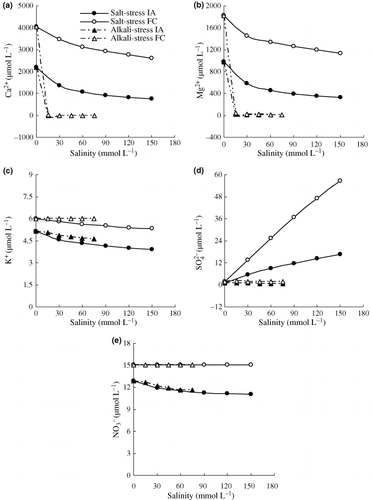
Figure 2 Effects of salt stress and alkali stress on the activities of (a) PO3− 4, (b) HPO2− 4, (c) H2PO− 4, and (d) the total ionic activities (IA) in the nutrient solutions.
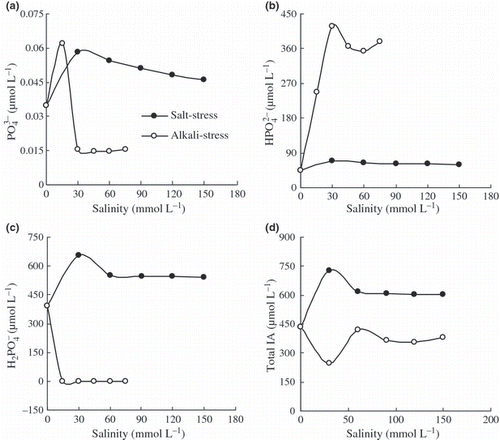
Figure 3 Effects of salt and alkali stresses on (a) under ground and (b) above ground relative growth rate (RGR), (c) water content, (d) electrolyte leakage, (e) chlorophyll a, (f) chlorophyll b, (g) carotenoid content and (h) root system activity. Salt stress: NaCl : Na2SO4 = 1:1, pH 6.6–6.95; alkali stress: NaHCO3 : Na2CO3 = 1:1, pH 9.77–9.96. The values are the means of five replicates. Means followed by different letters in the same curve are significantly different at P ≤ 0.05 according to a least significant difference test. FW, fresh weight.
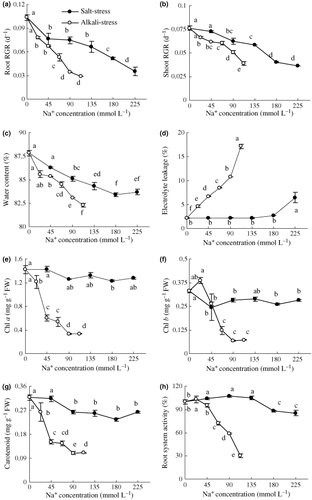
Table 2 Regression equation between the relative growth rate (RGR) and the salt concentration
Figure 4 Effects of salt and alkali stresses on the contents of (a) Na+, (b) K+, (c) free Fe2+, (d) free Mg2+ and (e) free Ca2+ in the wheat shoots. Salt stress: NaCl : Na2SO4 = 1:1, pH 6.6–6.95; alkali stress: NaHCO3 : Na2CO3 = 1:1, pH 9.77–9.96. The values are the means of five replicates. Means followed by different letters in the same curve are significantly different at P ≤ 0.05 according to a least significant difference test. DW, dry weight.
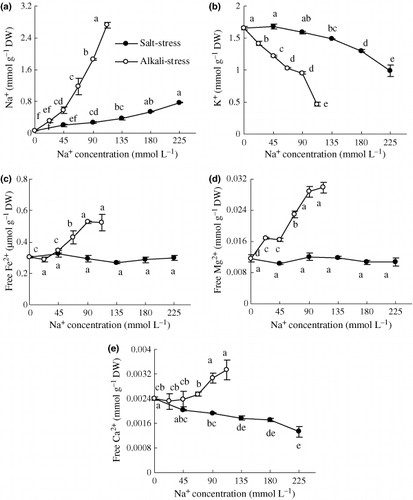
Figure 5 Effects of salt and alkali stresses on the contents of (a) Cl−, (b) SO42−, (c) NO3− and (d) H2PO4− in the wheat shoots. Salt stress: NaCl : Na2SO4 = 1:1, pH 6.6–6.95; alkali stress: NaHCO3 : Na2CO3 = 1:1, pH 9.77–9.96. The values are the means of five replicates. Means followed by different letters in the same curve are significantly different at P ≤ 0.05 according to least significant difference test. DW, dry weight.
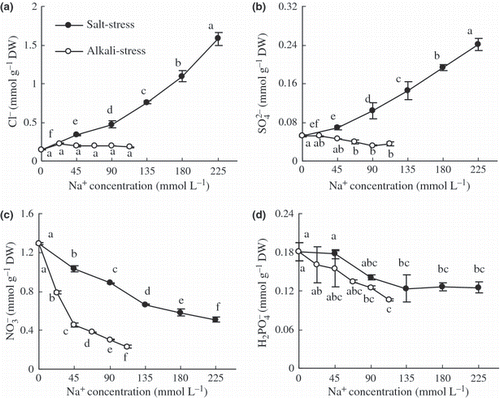
Figure 6 Effects of salt and alkali stresses on the contents of (a) proline, (b) soluble saccharides, (c) betaine and (d) organic acid in the wheat shoots. Salt stress: NaCl : Na2SO4 = 1:1, pH 6.6–6.95; alkali stress: NaHCO3 : Na2CO3 = 1:1, pH 9.77–9.96. The values are the means of five replicates. Means followed by different letters in the same curve are significantly different at P ≤ 0.05 according to least significant difference test. DW, dry weight.
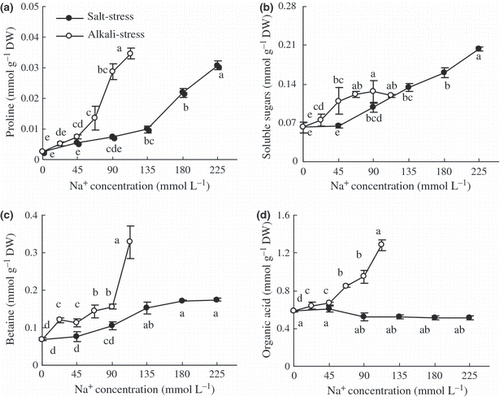
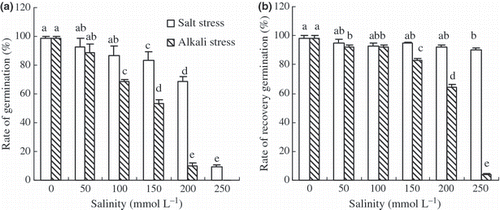
Figure 7 Effects of salt and alkali stresses on (a) the rate of germination and (b) the recovery germination of wheat. Salt stress: NaCl : Na2SO4 = 1:1, pH 6.66–7.01; alkali stress: NaHCO3 : Na2CO3 = 1:1, pH 9.83–10.03. The values are the means of five replicates. Means followed by different letters in the same column are significantly different at P ≤ 0.05 according to least significant difference test.