Figures & data
Table 1 Application rates of nitrogen (kg N ha−1)
Table 2 Forage yield (Mg ha−1 dry matter)
Table 3 Soil chemical properties
Figure 1 Seasonal variations in the atmospheric concentration of NH3 from March 2006 to March 2007 in the (a) manure and (b) fertilizer plots. Upper, 2.4 m height; lower, 0.7 m height; ‘Particle’, the averaged value of particle ammonium at 2.4 m height and 0.7 m height. The arrows with no sign show the timing of the chemical fertilizer application and the arrow with ‘M’ refers to the application of manure.
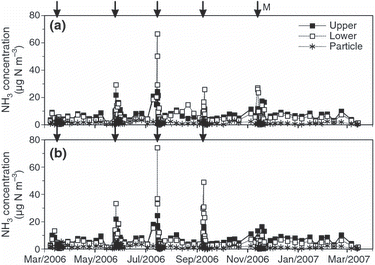
Figure 2 Seasonal variations in NH3 flux and soil temperature in (a) 2006–2007, (b) 2007–2008 and (c) 2008–2009. The arrows with no sign show the timing of the chemical fertilizer application and the arrow with ‘M’ refers to the application of manure.
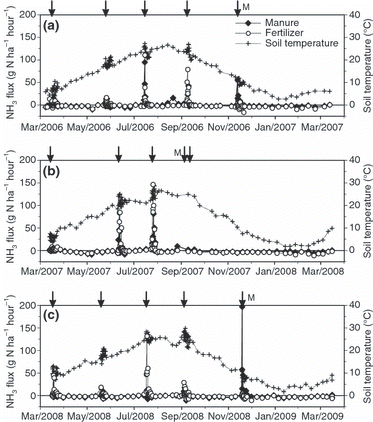
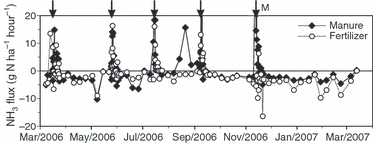
Figure 3 Seasonal variations in NH3 flux from March 2006 to March 2007. The vertical scale between −20 and +20 g N ha−1 h−1 has been magnified. The arrows with no sign show the timing of the chemical fertilizer application and the arrow with ‘M’ refers to the application of manure.