Figures & data
Figure 1. Judicial Efficiency and Economic Growth: The Main Hypothesis
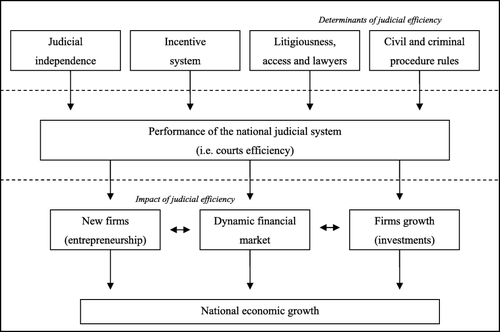
Table 1. Descriptive Statistics: Inputs and Outputs Adopted for the Technical Efficiency Scores Second Instance Districts (i.e., Distretti di Corte di Appello), 2005–2008
Table 2. Descriptive Statistics: Technical Efficiency Scores and Judicial Delay Second Instance Districts (i.e., Distretti di Corte di Appello), 2005–2008
Table 3. Descriptive Statistics: New Enterprises in Italy between 2006 and 2009
Table 4. Descriptive Statistics of Variables Adopted in the Empirical Analysis Second Instance Districts (i.e., Distretti di Corte di Appello), 2005–2008
Table 5. OLS Regression Model—Robust Option Immigrant Enterprises Birth Rate as Dependent Variable
Table 6. OLS Regression Model—Robust Option Autochthonous Enterprises Birth Rate as Dependent Variable
Table 7. NB Regression Model—Robust Option, Regression Results Presented as IRR Romanian, Chinese, and Albanian Population of One‐Man Enterprises (Count Variable)
Table A1 Descriptive Statistics: New Enterprises in Italy between 2006 and 2009—Place of Birth: Europe
Table A2 Pairwise Correlations (p‐Value in Parentheses)
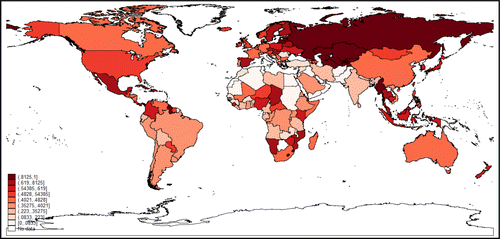
Figure A1 Percentage of Enterprises Based on the Entrepreneurs’ Place of Birth—Italy, 2006–2009 [Color figure can be viewed at http://wileyonlinelibrary.com]
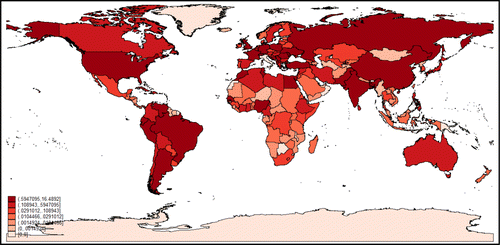
Figure A2 Percentage of Female Entrepreneurs Based on Their Place of Birth—Italy, 2006–2009 [Color figure can be viewed at http://wileyonlinelibrary.com]