Figures & data
Figure 1 Conceptual model linking CCU and SAU to CO and PO with feedback links indicated.
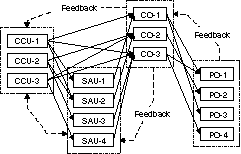
Table 1 Estimation of emphasis of CO in delivered CCU.
Table 2 Estimation of the level of emphasis of CO in delivered CCU.
Table 3 Estimation of emphasis of PO in delivered CCU.
Table 4 Estimation of the level of emphasis of PO in delivered CCU.
Table 5 Estimation of emphasis of CO in delivered SAU.
Table 6 Estimation of the level of emphasis of CO in delivered SAU.
Table 7 Estimation of the level of emphasis of PO in delivered SAU.
Table 8 Alignment of delivered SAU with CCU.
Table 9 Average performance of students on each CO as indicated by earned grades.
Table 10 Relative achievement of CO based on student performance.
Table 11 Relative achievement of PO based on student performance.
Figure 2 (a) Original alignment (before) and (b) re-alignment (after) of delivered CCU and SAU with CO as indicated by ICCU-CO, ISAU-CO, and ISAU-CO/ICCU-CO.
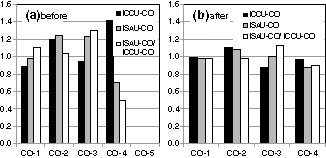
Figure 3 (a) Original alignment (before) and (b) re-alignment (after) of delivered CCU and SAU with PO as indicated by ICCU-PO, ISAU-PO, and ISAU-PO/ICCU-PO.
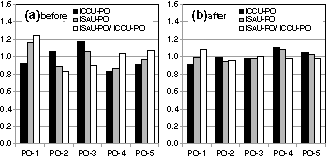
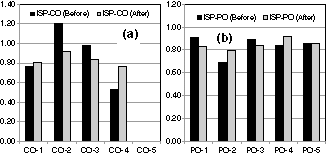
Figure 4 Relative achievement of (a) CO and (b) PO based on student performance before and after re-alignment of delivered CCU and SAU with CO and PO as indicated by ISP-CO and ISP-PO.