Figures & data
Figure 1 The scatterplot used to assess participation in seminars
Figure 2 Grading schemes for the seminar assessment
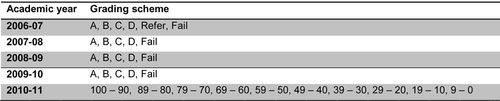
Figure 3 Students improving their grade, grouped by year

Figure 4 Percentage of students improving their grade, grouped by year
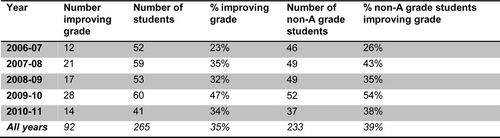
Figure 5 Students improving their grade, grouped by seminar paper grade
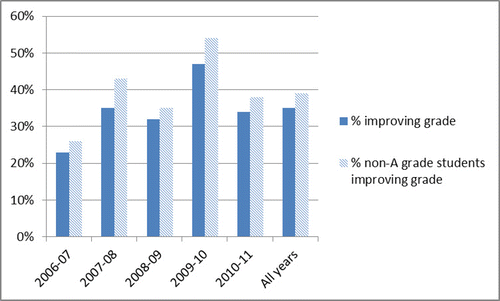
Figure 6 Percentage of students improving their grade, grouped by seminar paper grade
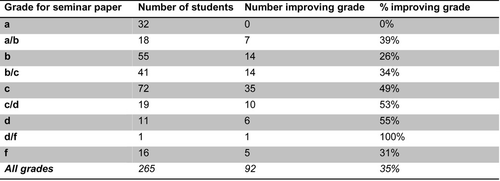
Figure 7 Improvement in individual assessment criteria
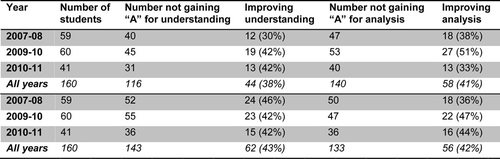
Figure 8 Percentage improvement in individual assessment criteria
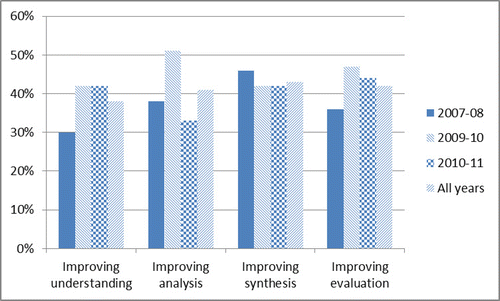
Figure 9 Is improvement uniform or patchy?
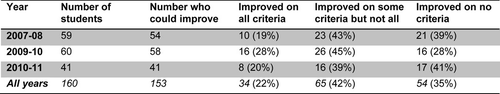
Figure 10 Is improvement uniform or patchy?
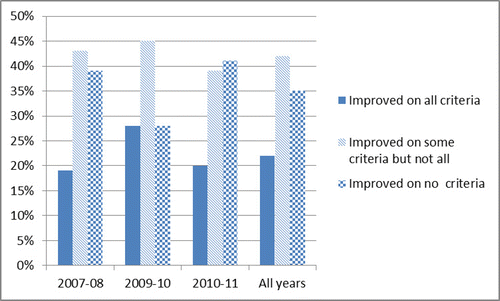
Figure 11 Do some student perform less well in the seminar presentation?
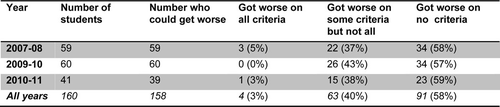
Figure 12 Percentage of students performing less well in the seminar presentation
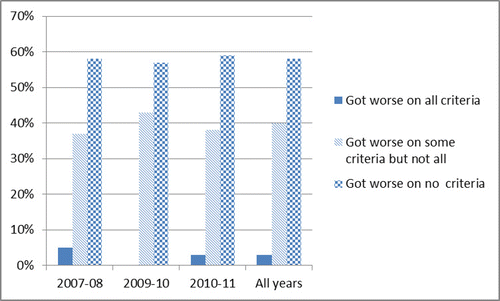
Figure 13 Whose performance gets worse?
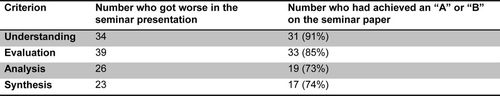
Figure 14 Percentage of “A” and “B” grade students whose presentations scored lower than their paper on the indicated criteria
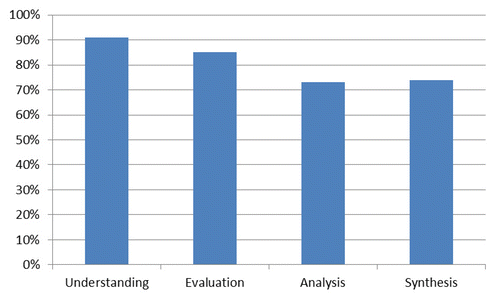
Figure 15 Who uses assessed seminars?
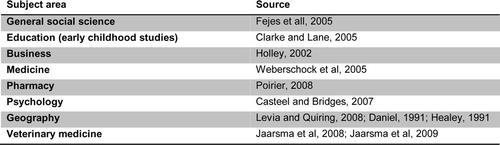
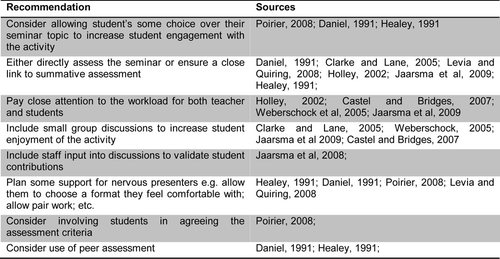
Figure 16 Best practices for assessed seminars, gleaned from the literature