Figures & data
FIG 1 Identification of consistent RIDD substrates containing IRE1 consensus target sequences. (A) Sequences of stem-loops cleaved by IRE1 in Hac1 and XBP1u and the consensus structure. (B) Venn diagram showing numbers and overlap of RIDD targets identified in the indicated data sets (So et al. 2012, reference Citation10; Hollien et al. 2009, reference Citation8; Han et al. 2009, reference Citation9). (C) RIDD targets identified in more than one study. The boldface transcripts contain the consensus IRE1 target sequence.
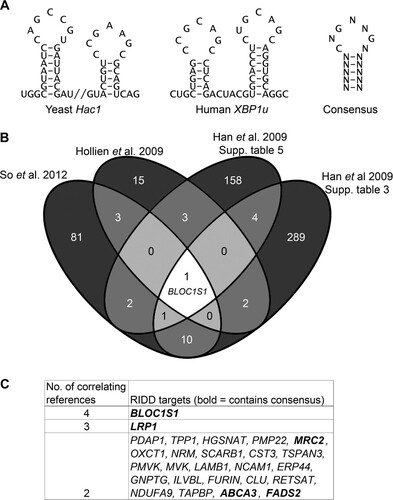
FIG 2 BLOC1S1 is a RIDD target in myeloma cells. (A) TaqMan qPCR measuring expression of consistently identified RIDD targets containing a consensus IRE1 target sequence in stressed or unstressed myeloma cell lines with or without ActD. (B) Relative BLOC1S1 expression measured by SYBR green qPCR in the indicated myeloma cell lines treated with 2 mM DTT in the presence or absence of DMSO vehicle control or 4μ8c pretreatment. (C) Representative agarose gel electrophoresis of the RT-PCR product surrounding the XBP1 splice site in the samples used for panel B. The qPCR data are normalized to GAPDH mRNA and are expressed relative to untreated cells. (A and B) The data are means ± standard errors of the mean (SEM) from three independent experiments. *, P < 0.05; **, P < 0.01; ***, P < 0.001; unpaired t test.
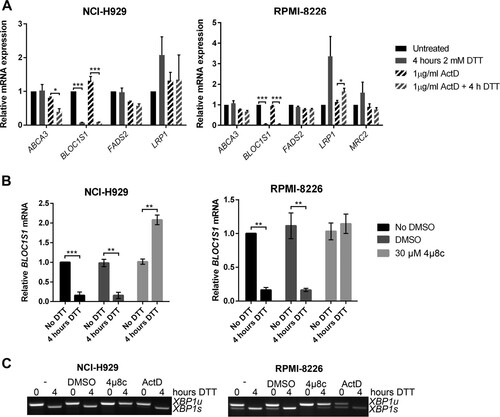
FIG 3 Degradation of BLOC1S1 is stressor dependent. (A) Relative quantities of BLOC1S1 in NCI-H929 and RPMI-8226 cells treated with the indicated stressors for 4 h. The mRNA level was measured by SYBR green qPCR and normalized to GAPDH and is shown relative to untreated cells. The data are means ± SEM of three independent experiments. (B) Representative agarose gel electrophoresis of the RT-PCR product surrounding the XBP1 splice site in the samples used for panel A. (C) Quantification of percent XBP1 splicing from the gel images shown in panel B. The data are means ± SEM of three independent experiments. *, P < 0.05; **, P < 0.01; ***, P < 0.001; unpaired t test compared to DMSO for tunicamycin and single-sample t test for DTT, where the vehicle was water.
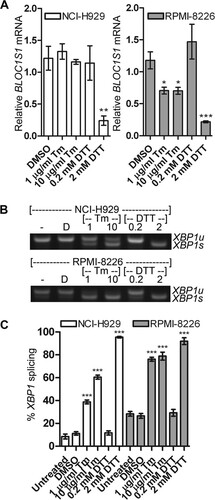
FIG 4 BLOC1S1 degradation and XBP1 splicing are temporally separate. (A and C) Relative expression of BLOC1S1 in NCI-H929 or RPMI-8226 cells treated with the indicated stressors over time. BLOC1S1 mRNA was measured by SYBR green qPCR and normalized to the GAPDH control and is presented relative to time zero. (B and D) Western blots showing phospho-IRE1, IRE1, and β-actin in the cells treated for panel A. Also shown is agarose gel electrophoresis of the RT-PCR product surrounding the XBP1 splice site from the samples used in panel A. (E to L) TaqMan qPCR measurements of BLOC1S1, XBP1u, and XBP1s for cells treated as indicated. The data were normalized to the GAPDH control and are presented relative to untreated cells. The data are representative of two independent experiments, and error bars show SEM from three technical replicates.
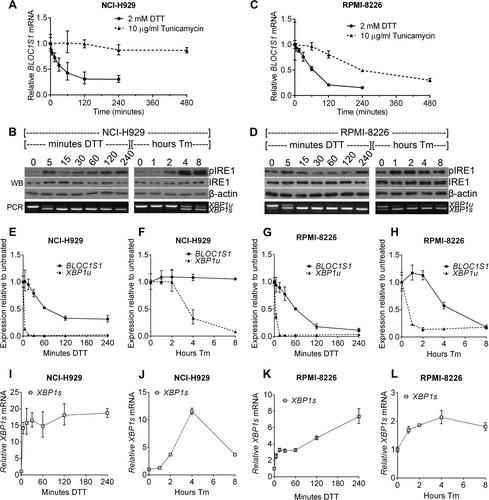
FIG 5 BLOC1S1 is cleaved by IRE1 at guanine 444 in vitro. (A) Sequence of BLOC1S1 surrounding guanine 444 that was identified as a consensus IRE1 target sequence bioinformatically. (B) Predicted secondary structure of full-length BLOC1S1 mRNA folded in silico using the RNAfold Web server. The stem-loop surrounding G444 is magnified and annotated in panel A. The colors represent the probability of base pairing. (C) (Left) Urea gel electrophoresis of XBP1u(266–602), WT BLOC1S1, and G444C BLOC1S1 RNA after in vitro cleavage by the indicated concentrations of IRE1 for 15 min. (Right) Urea gel electrophoresis of the indicated RNAs after in vitro cleavage by IRE1 (0.5 μM) for the indicated times. The identities of RNA fragments are shown between the two gels; size markers are shown on the right. (D) Sequence of human BLOC1S1 from the start codon to the poly(A) tail. All occurrences of the sequence identical to the first 6 bases of the loop sequence around G444 are indicated in boldface.
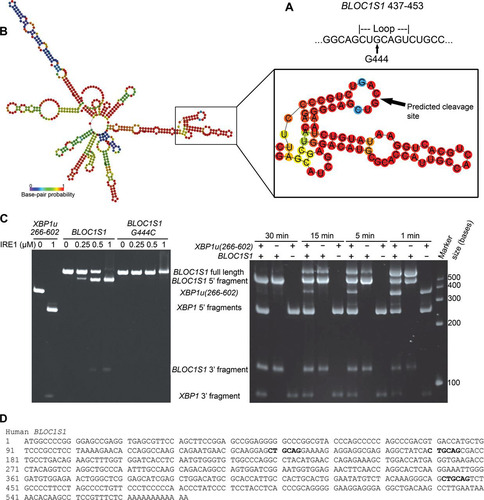
FIG 6 G444C mutation inhibits cleavage of BLOC1S1 by IRE1 in vivo. (A) SYBR green qPCR quantification of relative expression of total BLOC1S1 and qTag (exogenous BLOC1S1) mRNA in myeloma cell lines transduced with the indicated virus and treated with 2 mM DTT for 4 h. Measurements were normalized to GAPDH and are shown relative to untreated control cells. The data show means ± SEM from five independent experiments. *, P < 0.05; **, P < 0.01; ***, P < 0.001; unpaired t test. (B) Representative agarose gel electrophoresis of RT-PCR products surrounding the XBP1 splice site from the samples used in panel A.
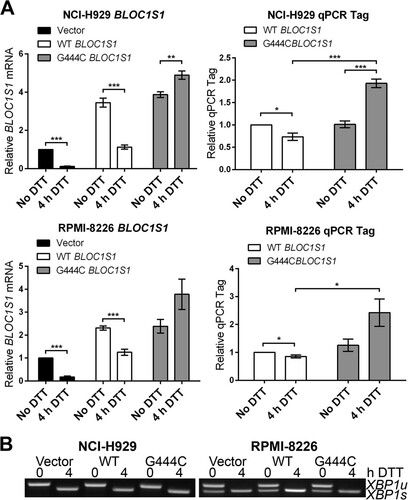
FIG 7 BLOC1S1 degradation is dispensable for recovery from acute stress. (A) SYBR green qPCR quantification of relative expression of BLOC1S1 in RPMI-8226 cells transduced as indicated and then treated with 2 mM DTT for 90 min, followed by washout and recovery for the indicated times. (B and C) TaqMan qPCR quantification of XBP1u (B) and XBP1s (C) in the samples used for panel A. (D) Representative agarose gel electrophoresis of the RT-PCR product surrounding the XBP1 splice site in the samples used for panel A. (E) SYBR green qPCR quantification of relative expression of CHOP in the samples used for panel A. (F) Relative cell viability measured by WST-1 assay of cells transduced as indicated and then treated with 2 mM DTT for 90 min, followed by washout and recovery for 24 h. Triton X-100 (0.5%) treatment after DTT washout in untransduced cells is shown as a control for maximal cell death. The measurements are background-subtracted absorbances relative to the absorbance of unstressed cells for each transduced sample. All qPCR measurements were normalized to GAPDH and are presented relative to 0 min of DTT treatment in DMSO-treated cells. All the graphs show means ± SEM of three (A to C and E) or four (F) independent experiments.
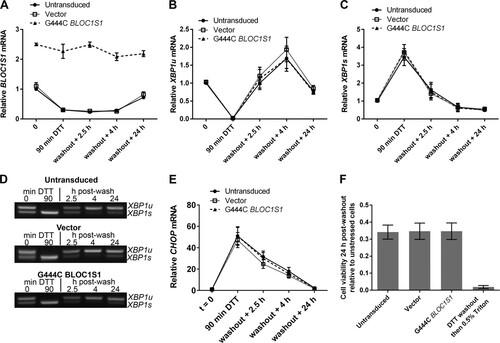
FIG 8 Inhibition of RIDD does not affect RPMI-8226 cell viability under acute ER stress. (A) Agarose gel electrophoresis of the RT-PCR product surrounding the XBP1 splice site in samples from RPMI-8226 cells pretreated for the indicated times with the indicated concentration of 4μ8c and then treated with 2 mM DTT for 90 min. −, untreated cells; DTT, DTT alone. (B) SYBR green qPCR showing relative expression of BLOC1S1 mRNA in RPMI-8226 cells treated with 30 μM 4μ8c at −10 min (t = −10) (pretreatment) or at 15 min of DTT (post-DTT) and treated with DTT at time zero (t = 0) for 90 min before washout and recovery for the indicated times. DMSO, vehicle control-treated cells. (C and D) TaqMan qPCR quantification of XBP1u (C) and XBP1s (D) in the samples used for panel B. (E) Representative agarose gel electrophoresis of the RT-PCR product surrounding the XBP1 splice site in the samples from panel B. The arrows indicate the times of addition of the indicated treatments or washout. (F) SYBR green qPCR of relative CHOP expression in the samples used for panel B. (G) WST-1 cell viability assays of RPMI-8226 cells treated as for panel B or treated with 4μ8c or DMSO without DTT treatment. The data are relative to untreated cells; 0.5% Triton X-100 after DTT washout is shown as a control for maximal cell death. All the graphs show means ± SEM from four (B, F, and G) or three (C and D) independent experiments. n.s., P > 0.05 (unpaired t test). All qPCR measurements were normalized to GAPDH and are presented relative to time −10 for DMSO-treated cell samples.
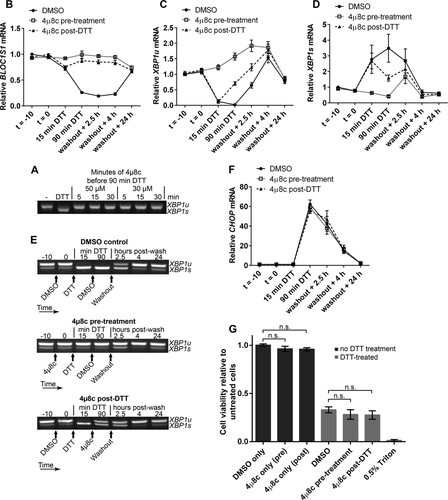
FIG 9 Inhibition of RIDD does not affect NCI-H929 cell viability under acute ER stress. (A) WST-1 cell viability assays of NCI-H929 cells treated as indicated with 2 mM DTT for 60 min (from time zero) and either pretreated (at time −10 min) or posttreated (at time 15 min) with 30 μM 4μ8c and then washed and allowed to recover for 24 h. Cells treated with 0.5% Triton X-100 were included as a dead-cell control. (B) SYBR green qPCR quantification of BLOC1S1 in the DTT-treated samples from panel A. (C) Representative agarose gel electrophoresis of the RT-PCR product surrounding the XBP1 splice site in the DTT-treated samples from panel A. The timing of treatments is indicated below the gel images. (D and E) TaqMan qPCR quantification of XBP1u (D) or XBP1s (E) in the DTT-treated samples from panel A. (F) SYBR green qPCR of relative CHOP expression in the DTT-treated samples from panel A. All qPCR data are normalized to GAPDH and are presented relative to the DMSO control at time −10 min of DTT. All the graphs show means ± SEM from three independent experiments. n.s., P > 0.05 (unpaired t test).
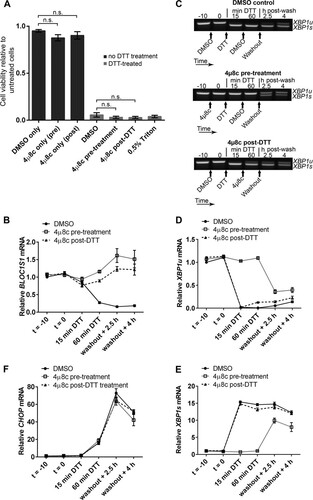
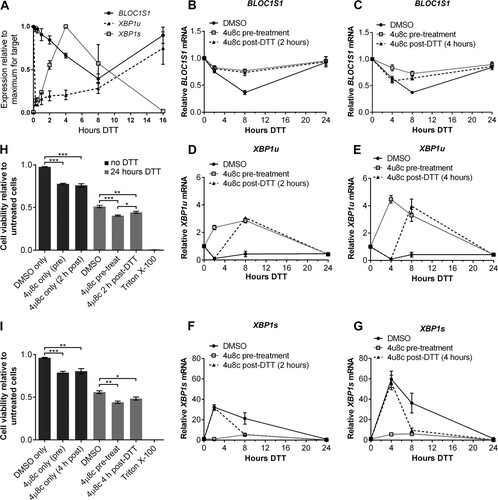
FIG 10 RIDD is dispensable for cell viability under DTT treatment in HT-1080 fibrosarcoma cells. (A) TaqMan qPCR measuring BLOC1S1, XBP1u, or XBP1s in HT-1080 cells treated with 2 mM DTT for the indicated times. The data are normalized to GAPDH and are presented relative to the maximum for each transcript. (B to G) SYBR green (BLOC1S1) or TaqMan (XBP1u and XBP1s) qPCR measurements of the indicated transcripts over a time course of DTT (2 mM) treatment in HT-1080 cells that were treated with 4μ8c (30 μM) 10 min before (pretreatment) or 2 h or 4 h after (post-DTT) addition of DTT. The data are normalized to GAPDH and are presented relative to untreated cells. (H and I) WST-1 measurement of the viability of HT-1080 cells treated with 2 mM DTT or 30 μM 4μ8c, as indicated. Triton X-100 treatment is shown as a dead-cell control. The data show means ± SEM from three (A) or four (B to I) independent experiments. *, P < 0.05; **, P < 0.01; ***, P < 0.001; unpaired t test.