
Figures & data
FIG 1 Glucose starvation does not activate autophagy flux. (A) Wild-type or ULK1/2 DKO MEF were exposed (+) or not exposed (−) to glucose starvation (−Glc), in the presence (+) or absence (−) of Baf A1, as indicated, for 2 or 18 h. Starvation conditions included 10% dialyzed FBS. FM, full-nutrient control medium. The cell lysates were analyzed for LC3B lipidation and quantified as LC3-II/LC3-I (n = 3 experiments; the error bars indicate standard errors of the mean [SEM]). Two different lines of ULK1/2 DKO MEF were analyzed. (B) Cells were exposed to amino acid (−AA) or glucose starvation for the indicated times. Starvation conditions included 10% dialyzed FBS. The cell lysates were analyzed for LC3B, phospho- or total ACC, and phospho- or total ribosomal S6 (S6). Quantification was based on 3 experiments; the error bars indicate SEM. *, P < 0.05; **, P < 0.01; ***, P < 0.001; ****, P < 0.0001; t test.
![FIG 1 Glucose starvation does not activate autophagy flux. (A) Wild-type or ULK1/2 DKO MEF were exposed (+) or not exposed (−) to glucose starvation (−Glc), in the presence (+) or absence (−) of Baf A1, as indicated, for 2 or 18 h. Starvation conditions included 10% dialyzed FBS. FM, full-nutrient control medium. The cell lysates were analyzed for LC3B lipidation and quantified as LC3-II/LC3-I (n = 3 experiments; the error bars indicate standard errors of the mean [SEM]). Two different lines of ULK1/2 DKO MEF were analyzed. (B) Cells were exposed to amino acid (−AA) or glucose starvation for the indicated times. Starvation conditions included 10% dialyzed FBS. The cell lysates were analyzed for LC3B, phospho- or total ACC, and phospho- or total ribosomal S6 (S6). Quantification was based on 3 experiments; the error bars indicate SEM. *, P < 0.05; **, P < 0.01; ***, P < 0.001; ****, P < 0.0001; t test.](/cms/asset/49f916db-20c9-471f-b32c-bc532b68b5f5/tmcb_a_12276758_f0001.jpg)
FIG 2 Amino acid starvation activates rapid beclin1-dependent autophagy flux. (A) Wild-type MEF expressing mRFP-EGFP-LC3B were exposed to FM or amino acid (−AA) or glucose (−Glc) starvation in the presence of Baf A1, as indicated, for 2 h. Starvation conditions included 10% dialyzed FBS. Autophagy membranes visible in the GFP and RFP channels are shown. The arrowheads show RFP+-only (i.e., GFP-quenched, late) autophagosomes. Scale bar, 10 μm. (B) GFP- and RFP-positive autophagy membranes were quantified in wild-type or ULK1/2 DKO MEF expressing mRFP-EGFP-LC3B following starvation conditions 1 to 6 (as in panel A) for 2 or 18 h. Quantification was done using 30 to 40 cells from three 2-h experiments or 20 to 32 cells from two 18-h experiment; the error bars indicate SEM. *, P < 0.05; ***, P < 0.001; unpaired t test comparing conditions 3 versus 4 and 5 versus 6. (C) MEF (wild type or with stable beclin1 knockdown [shBecl1]) were starved as indicated with Baf A1 for 2 h. Starvation conditions included 10% dialyzed FBS. Endogenous LC3B-positive autophagy membranes were detected and quantified in 120 cells (from 2 experiments). Beclin1 knockdown efficiency was confirmed. Boxes show the 25th and 75th percentiles and means, and the whiskers show standard deviations. ×, 1st and 99th percentiles; ***, P < 0.001; ANOVA with Tukey's posttest.
![FIG 2 Amino acid starvation activates rapid beclin1-dependent autophagy flux. (A) Wild-type MEF expressing mRFP-EGFP-LC3B were exposed to FM or amino acid (−AA) or glucose (−Glc) starvation in the presence of Baf A1, as indicated, for 2 h. Starvation conditions included 10% dialyzed FBS. Autophagy membranes visible in the GFP and RFP channels are shown. The arrowheads show RFP+-only (i.e., GFP-quenched, late) autophagosomes. Scale bar, 10 μm. (B) GFP- and RFP-positive autophagy membranes were quantified in wild-type or ULK1/2 DKO MEF expressing mRFP-EGFP-LC3B following starvation conditions 1 to 6 (as in panel A) for 2 or 18 h. Quantification was done using 30 to 40 cells from three 2-h experiments or 20 to 32 cells from two 18-h experiment; the error bars indicate SEM. *, P < 0.05; ***, P < 0.001; unpaired t test comparing conditions 3 versus 4 and 5 versus 6. (C) MEF (wild type or with stable beclin1 knockdown [shBecl1]) were starved as indicated with Baf A1 for 2 h. Starvation conditions included 10% dialyzed FBS. Endogenous LC3B-positive autophagy membranes were detected and quantified in 120 cells (from 2 experiments). Beclin1 knockdown efficiency was confirmed. Boxes show the 25th and 75th percentiles and means, and the whiskers show standard deviations. ×, 1st and 99th percentiles; ***, P < 0.001; ANOVA with Tukey's posttest.](/cms/asset/603748af-2549-4412-b66e-3e3a36e1eb43/tmcb_a_12276758_f0002.jpg)
FIG 3 Lack of autophagy flux following glucose starvation is conserved in cancer cells. (A) The indicated cell types were incubated with glucose or amino acid starvation for 3 h. As a control, CQ (25 μM) was added to cells under full-nutrient conditions. UT, untreated. (B) MCF7 or A431 cells were treated with prolonged starvation (24 h) as indicated. Starvation conditions included 10% dialyzed FBS. Cell lysates were analyzed for LC3B, sequestosome 1/p62 protein levels, and S6 protein phosphorylation. The data are representative of the results of 3 experiments. (C) MCF7 or A431 cells were starved as indicated for 3 or 24 h. Transcript levels for LC3B and p62 were quantified (expressed as fold change normalized to GAPDH; n = 3; the error bars indicate SEM). *, P < 0.05; ***, P < 0.001; ****, P < 0.0001; ANOVA with Tukey's posttest. (D and E) A431 cells stably expressing mCherry-EGFP-LC3B were starved as indicated with Baf A1 for 2 h. Starvation conditions included 10% dialyzed FBS. GFP- and RFP-positive autophagy membranes were quantified in 120 cells from 3 experiments; the error bars indicate SEM. ****, P < 0.0001; unpaired t test comparing –AA and –Glc conditions. Scale bar, 10 μm.
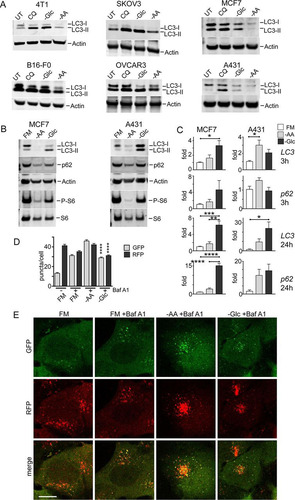
FIG 4 Amino acid starvation triggers dephosphorylation of ULK1 serine 555 and autophagy. (A) HEK293A cells were incubated under amino acid or glucose starvation conditions for 2 h. Where indicated, bafilomycin A1 or 10% dialyzed FBS was added. Immunoblotting detected LC3B lipidation, P-ACC, and P-S6 levels in lysates. (B) Quantification of LC3B lipidation ratios was based on 3 experiments; the error bars indicate SEM. **, P < 0.01; unpaired t test. (C) HEK293A cells were starved of amino acid or glucose for the indicated times. All conditions were with bafilomycin A1. Quantification was based on 3 experiments; the error bars indicate SEM. *, P < 0.05; **, P < 0.01; ANOVA with Tukey's posttest comparing UT and –AA conditions. (D) HEK293A cells were incubated under amino acid or glucose starvation for the indicated times. Starvation conditions included 10% dialyzed FBS. Parallel wells of control cells were replenished with full-nutrient medium at the start of incubation. The cell lysates were analyzed for ULK1 serine 555 phosphorylation, P-ACC, LC3B, and p62 levels. Representative quantification is shown below the phosphoblots. Quantification of p62 degradation and LC3B ratios was based on 3 experiments; the error bars indicate SEM. ***, P < 0.001; ANOVA with Tukey's posttest. (E) HEK293A stably expressing mCherry-EGFP-LC3B were incubated under the indicated starvation conditions (1 to 6) for 2 h. Starvation conditions included 0.1% dialyzed FBS. **, P < 0.01; ****, P < 0.0001; unpaired t test comparing conditions 3 versus 4 and 5 versus 6. Scale bar, 10 μm.
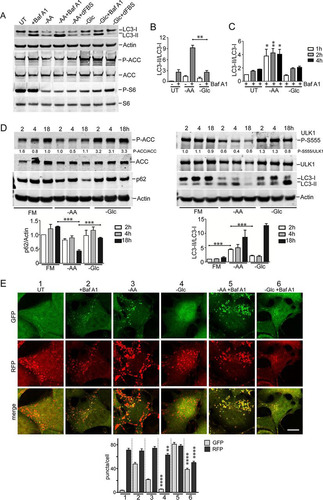
FIG 5 Glucose starvation inhibits autophagosome formation. (A) HEK293A cells were incubated under amino acid or glucose starvation for 2 h. Starvation conditions included 0.1% dialyzed FBS. Cells were stained for endogenous ULK1- or p62-labeled autophagosomes. Scale bars, 10 μm. (B) HEK293A cells were starved as for panel A for the times indicated, and ULK1 and p62 puncta/cell were quantified. Each box represents 38 cells, representative of the results of 2 experiments. (C) Wild-type MEF expressing GFP-DFCP1 were starved of amino acids as for panel A for 2 h. The cells were stained for endogenous p62 puncta. The arrowheads point to the autophagosome shown enlarged in the insets. Scale bar, 10 μm. (D) HEK293A cells were starved of amino acids for 2 h. Starvation conditions included 0.1 or 5% dialyzed FBS or addition of MRT68921 (10 μM), as indicated. Each box represents 40 cells, representative of the results of 2 experiments. (E) HEK293A cells were starved of amino acids, glucose, or both together for 2 h. Dialyzed serum concentrations were also varied during starvation, as indicated. Each box represents 40 to 50 cells, representative of the results of 2 experiments. In box-and-whisker plots, the boxes show the 25th and 75th percentiles and means, and the whiskers show standard deviations. ×, 1st and 99th percentiles; ****, P < 0.0001; ANOVA with Tukey's posttest.
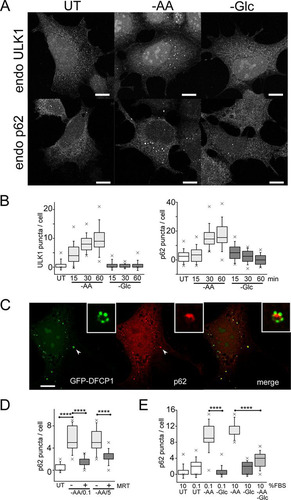
FIG 6 Differential effects of glucose and amino acids (glutamine, leucine, and arginine) on autophagy signaling. (A) HEK293A cells were starved of amino acids, glucose, or both together for 2 h. Starvation conditions included 10% dialyzed FBS. Bafilomycin A1 was included as indicated. The cell lysates were analyzed for LC3B lipidation and quantified based on 3 experiments; the error bars indicate SEM. *, P < 0.05; unpaired t test. (B) HEK293A cells were starved as for panel A and analyzed for P-ACC, P-S6, and phosphorylation at the indicated ULK1 sites. Representative quantification is shown below the phosphoblots. (C) HEK293A cells were starved of amino acids (in the presence of 10% dialyzed FBS). Where indicated, starvation media contained bafilomycin A1 with the amino acids glutamine (Q), leucine (L), and/or arginine (R) added back. The data are representative of the results of 3 experiments. (D and E) HeLa cells were starved of amino acids (in the presence of 5% dialyzed FBS), with amino acids added back as indicated. Endogenous p62 puncta were analyzed. Scale bar, 10 μm. (D) Each plot represents 40 cells, representative of the results of 2 experiments. Boxes show the 25th and 75th percentiles and means, and the whiskers show standard deviations. ×, 1st and 99th percentiles; ****, P < 0.0001; unpaired t test.
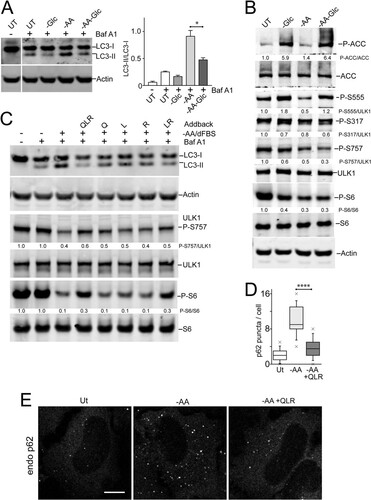
FIG 7 Glutamine, leucine, and arginine activate MTORC1 and inhibit ULK1 complex translocation to autophagosome assembly sites. HEK293A cells stably expressing LAMP1-mRFP were starved of amino acids for 2 h or starved for 110 min, followed by 10 min resupplementation with glutamine, leucine, and arginine (in the presence of 5% dialyzed FBS). The fixed cells were stained for endogenous MTOR (A), ULK1 (B), or ATG13 (C). The arrows in the enlarged insets indicate MTOR localized on lysosomal membranes in response to glutamine, leucine, and arginine (A) and localization of the ULK1 complex on autophagosome assembly sites juxtaposed to lysosomal membranes in response to amino acid starvation (B and C). Scale bars, 10 μm.
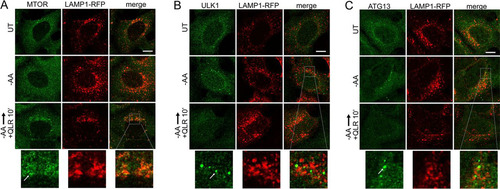
FIG 8 Inhibition of autophagosome formation by AMPK. (A) HEK293A cells were starved of amino acids in the presence or absence of A769662 (50 μM) for 2 h. Starvation conditions included 5% dialyzed FBS. The cell lysates were analyzed for phosphorylation of ACC and S6. (B) HEK293A cells stably expressing mCherry-EGFP-LC3B were incubated under starvation conditions (1 to 5) for 2 h. Starvation conditions included 0.1% dialyzed FBS. Scale bar, 10 μm. (C) Quantification of the data in panel B. Each plot represents 135 cells from 3 experiments; the error bars indicate SEM. ****, P < 0.0001; unpaired t test comparing conditions 2 versus 3 and 4 versus 5 (for both GFP and RFP quantifications). (D) HEK/mCherry-EGFP-LC3B cells as in panel B were starved of amino acids, or amino acid and glucose together, for 2 h. Starvation conditions included 0.1% dialyzed FBS. Each plot represents 45 cells representative of 3 experiments; the error bars indicate SEM. ****, P < 0.0001; unpaired t test comparing –AA versus double-starved conditions (for both GFP and RFP quantifications).
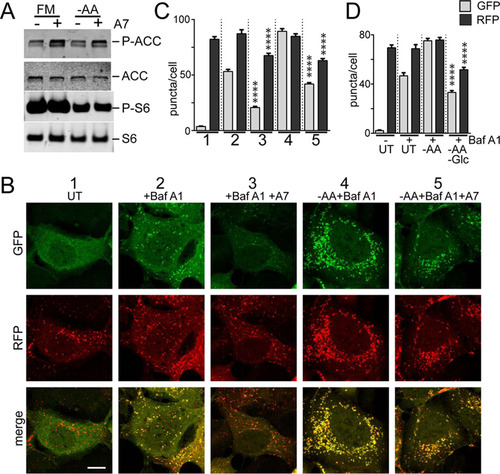
FIG 9 Phosphorylation of ULK1 by AMPK inhibits autophagosome formation. (A) HEK293A cells were starved of amino acids in the presence or absence of A769662 (50 μM) for 2 h. Starvation conditions included 0.1% dialyzed FBS. The fixed cells were stained for endogenous p62- or ULK1-labeled autophagosomes and quantified. Each plot represents 135 cells from 3 experiments. ****, P < 0.0001; unpaired t test. (B) ULK1/2 DKO cells were reconstituted with Myc-ULK1, wild type or 4SA (S467A, S555A, T574A, and S637A). Expression levels were confirmed by immunoblotting with anti-ULK1 antibody. (C) ULK1/2 DKO cells reconstituted with wild-type or 4SA Myc-ULK1 were starved of amino acids in the presence or absence of A769662 for 2 h. Starvation conditions included 10% dialyzed FBS. The fixed cells were stained for endogenous p62 puncta. Scale bar, 10 μm. (D) The experiment shown in panel C was quantified. Each plot represents 90 to 135 cells from 3 experiments. ***, P < 0.001; ANOVA with Tukey's posttest. (E) Cells as in panel C were starved of amino acids, or amino acid and glucose together, for 2 h. Starvation conditions included 10% dialyzed FBS. Each plot represents 135 cells from 3 experiments. In box-and-whisker plots, the boxes show the 25th and 75th percentiles and means, and the whiskers show standard deviations. ×, 1st and 99th percentiles; ***, P < 0.001; ANOVA with Tukey's posttest.
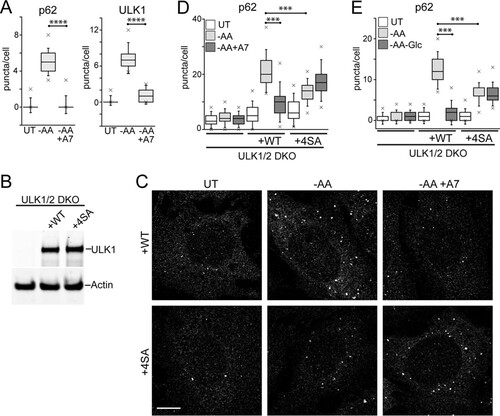
FIG 10 Glucose starvation and AMPK inhibit lysosomal acidification. (A and B) HEK293A cells were starved of amino acids for 2 h and stained using Lysotracker Red DND-99. Starvation conditions included 0.1% dialyzed FBS. Where indicated, starvation included CQ or bafilomycin A1. Lysotracker staining intensity per cell was quantified from confocal images (arbitrary units). Each box represents 60 cells, representative of the results of 4 experiments. (C) HeLa cells were starved of serum, amino acids, or glucose for 2 h and analyzed for Lysotracker staining. Amino acid and glucose starvation conditions included 0.1% dialyzed FBS. (D) Quantification of the data in panel C. Each box represents 50 to 60 cells, representative of the results of 4 experiments. (E) The experiment shown in panels C and D was repeated in HEK293A cells. Each box represents 50 to 60 cells, representative of the results of 4 experiments. (F and G) Wild-type or ATG5 knockout MEF were starved and analyzed as for panel C. Each box represents 40 to 50 cells, representative of the results of 5 experiments. (H) ULK1/2 DKO or FIP200 KO MEF were starved of amino acids and analyzed as for panels C and D. Each box represents 270 to 320 cells from 3 experiments. (I) HEK293A cells were starved of amino acids, or amino acid and glucose together, for 2 h as for panel C. Where indicated, the double-starvation conditions included adding back d-glucose (1 g/liter). Each box represents 60 cells, representative of the results of 4 experiments. (J to L) Wild-type MEF (or HEK293A cells [L]) were starved of amino acids in the presence or absence of A769662 (50 μM) for 2 h and analyzed as for panels C and D. Each box represents 120 cells from 2 experiments. In box-and-whisker plots, the boxes show the 25th and 75th percentiles and means, and the whiskers show standard deviations. ×, 1st and 99th percentiles; ****, P < 0.0001; unpaired t test. Scale bars, 20 μm.
![FIG 10 Glucose starvation and AMPK inhibit lysosomal acidification. (A and B) HEK293A cells were starved of amino acids for 2 h and stained using Lysotracker Red DND-99. Starvation conditions included 0.1% dialyzed FBS. Where indicated, starvation included CQ or bafilomycin A1. Lysotracker staining intensity per cell was quantified from confocal images (arbitrary units). Each box represents 60 cells, representative of the results of 4 experiments. (C) HeLa cells were starved of serum, amino acids, or glucose for 2 h and analyzed for Lysotracker staining. Amino acid and glucose starvation conditions included 0.1% dialyzed FBS. (D) Quantification of the data in panel C. Each box represents 50 to 60 cells, representative of the results of 4 experiments. (E) The experiment shown in panels C and D was repeated in HEK293A cells. Each box represents 50 to 60 cells, representative of the results of 4 experiments. (F and G) Wild-type or ATG5 knockout MEF were starved and analyzed as for panel C. Each box represents 40 to 50 cells, representative of the results of 5 experiments. (H) ULK1/2 DKO or FIP200 KO MEF were starved of amino acids and analyzed as for panels C and D. Each box represents 270 to 320 cells from 3 experiments. (I) HEK293A cells were starved of amino acids, or amino acid and glucose together, for 2 h as for panel C. Where indicated, the double-starvation conditions included adding back d-glucose (1 g/liter). Each box represents 60 cells, representative of the results of 4 experiments. (J to L) Wild-type MEF (or HEK293A cells [L]) were starved of amino acids in the presence or absence of A769662 (50 μM) for 2 h and analyzed as for panels C and D. Each box represents 120 cells from 2 experiments. In box-and-whisker plots, the boxes show the 25th and 75th percentiles and means, and the whiskers show standard deviations. ×, 1st and 99th percentiles; ****, P < 0.0001; unpaired t test. Scale bars, 20 μm.](/cms/asset/f8abb838-b557-48ab-b683-fa956697632c/tmcb_a_12276758_f0010.jpg)