Figures & data
FIG 1 Hyperosmotic stress induces autophagosomal structures in MEFs and T24 cells. (A) Wild-type MEFs and T24 cells were cultured in DMEM (control) or DMEM with 0.8 M sucrose or 0.4 M NaCl for 30 min. The cells were fixed and double immunolabeled for WIPI2 (red) and p62 (green). The boxed regions are magnified in the insets. Punctate structures positive for both signals (yellow) are indicated by arrowheads. Bars, 10 μm. (B) After being subjected to osmotic stress with 0.8 M sucrose for 1 h, the cells were further cultured for 24 or 48 h. They were then fixed with 4% paraformaldehyde, and the nuclei were stained with Hoechst 3334. Images were acquired with a fluorescence microscope. The boxed regions are magnified in the insets. Note that no apparent nuclear fragmentation is observed and that the smaller condensed structures are chromosomes in a cell division phase. Bars, 50 μm.
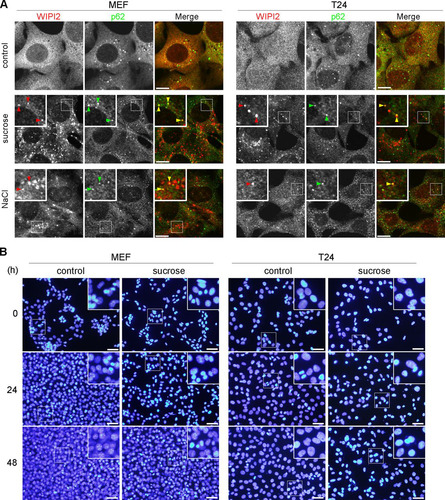
FIG 2 WIPI2/Atg16L punctum formation after hyperosmotic stress is dependent on Vps34. (A) Wild-type MEFs and T24 cells were cultured in DMEM with dimethyl sulfoxide (DMSO) or 200 nM Vps34-IN1 for 60 min and shifted to medium containing 0.8 M sucrose with the same concentration of DMSO or Vps34-IN1. After incubation for 30 min, they were fixed and double immunolabeled for Atg16L and WIPI2. Bars, 10 μm. (B) Wild-type MEFs and T24 cells were cultured in DMEM with DMSO or 1 μM wortmannin for 120 min and shifted to medium containing 0.8 M sucrose with the same concentration of DMSO or wortmannin. After incubation for 30 min, they were fixed and double immunolabeled for WIPI2 and Atg16L. Bars, 10 μm. (C) T24 cells transfected with siRNAs for control (si-control) or hVPS34 (si-hVPS34) were shifted to hyperosmotic medium for 30 min. They were then fixed and immunolabeled for WIPI2. Depletion of hVPS34 by the siRNAs was confirmed by Western blotting (bottom). GAPDH was used as a loading control. The antibodies (Ab) used and molecular weights are shown. Bars, 10 μm.
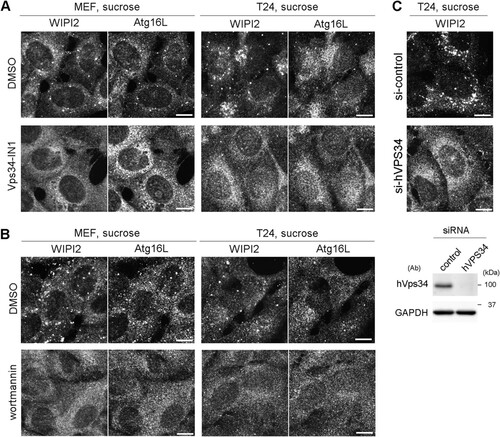
FIG 3 Electron microscopic analyses for autophagosomal structures and WIPI2 localization under hyperosmotic stress. (A to D) Wild-type MEFs were cultured in DMEM with (B to D) or without (A) 0.8 M sucrose for 1 h and then fixed for EM. The boxed region in panel B is shown enlarged in panel C. (E) Wild-type MEFs were cultured in DMEM with 0.8 M sucrose for 30 min and then fixed with 4% paraformaldehyde alone (left) or 4% paraformaldehyde-0.01% glutaraldehyde (right) for immuno-EM using anti-WIPI2 antibody. Note that after hyperosmotic stress, large endosome-like structures (asterisks), lysosome-like profiles (L), and degenerated mitochondria (M) increased. m, mitochondria in the control; N, nucleus. Bars, 0.5 μm.
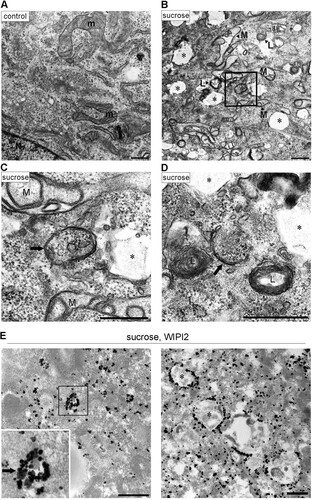
FIG 4 Hyperosmotic stress induces lysosomal degradation of p62 and NcoA4. (A to C) Wild-type MEFs (A and B) and T24 cells (C) were cultured with or without 100 nM bafilomycin A1 (BafA1) for 16 h and then shifted to DMEM with 0.8 M sucrose or 0.4 M NaCl for 0, 1, or 2 h, as indicated. The lysates were analyzed by Western blotting using antibodies against p62 (A), NcoA4 (B and C), or GAPDH. Molecular weights are indicated on the right. Bands of short and long exposure (exp.) are shown for NcoA4. The experiments were repeated 3 (A), 4 (B), and 5 (C) times. Band intensities were quantified, and ratios to the control value are plotted on the right. Statistical significances were determined by Student's t test. *, P < 0.05; **, P < 0.01. (D) Wild-type MEFs were cultured without (cont.) or with 100 nM BafA1 or two proteasome inhibitors, 5 μM epoxomicin (Epo) and 10 μM lactacystin (Lac), for 6 h. They were then shifted to DMEM with 0.8 M sucrose for 1 h (+). The lysates were analyzed by Western blotting using antibodies (Ab) against p62, NcoA4, or GAPDH, as indicated. Molecular weights are shown on the right. (E) MEFs transfected with mCherry-p62 (red) were cultured in DMEM (control) or DMEM with 0.8 M sucrose for 1 h and then fixed and immunostained for Lamp1 (green). The boxed regions are magnified in the insets. Bars, 10 μm.
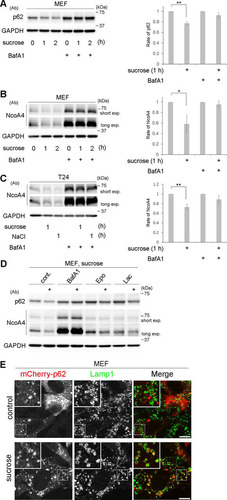
FIG 5 Ulk1 is phosphorylated at S757, while mTOR kinase activity is partially suppressed under hyperosmotic stress. (A) Wild-type MEFs and T24 cells were cultured with amino acid-free DMEM (−AA) or Hanks balanced salt solution (HBSS) or DMEM with 0.8 M sucrose, 0.8 M mannitol, 0.4 M NaCl, or 0.4 M KCl for 1 h. A sample without the cultures was also included in the leftmost lane (0 h). Cells were lysed for Western blot analyses using antibodies against phosphorylated mTOR (S2448), mTOR, phosphorylated Ulk1 (S575), Ulk1, phosphorylated S6K1 (T389), S6K1, phosphorylated 4E-BP1 (T37/46), 4E-BP1, and GAPDH as a loading control. Molecular weights are indicated on the right. (B) The experiments were repeated 3 times. Band intensities were quantified, and the ratio of the phosphorylated form to total protein was calculated, which was then compared to the control value. Statistical significance between the control and each condition was determined by Student's t test. *, P < 0.05; **, P < 0.01; NS, not significant.
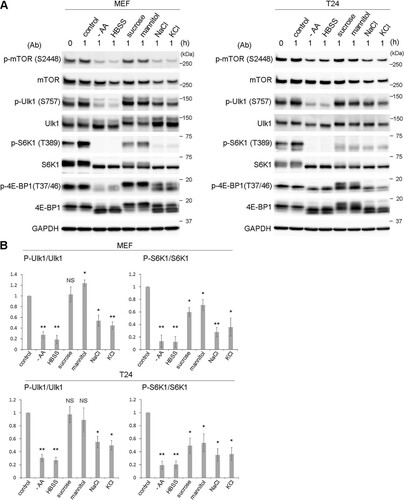
FIG 6 mTORC1 contributes to the phosphorylation of Ulk1 at S757 under hyperosmotic stress. Wild-type MEFs and T24 cells cultured for 1 h in DMEM with DMSO (control) or 1 μM torin 1 (+) were further cultured for 1 h in DMEM with 0.8 M sucrose containing the same reagents. The cells were also cultured in amino acid-free DMEM (−AA) for 1 h. The cell lysates were analyzed for Western blotting using antibodies against phosphorylated Ulk1 (S575), Ulk1, phosphorylated Akt (S473), Akt, phosphorylated S6K1 (T389), S6K1, phosphorylated 4E-BP1 (T37/46), 4E-BP1, and GAPDH as a loading control. Molecular weights are indicated on the right.
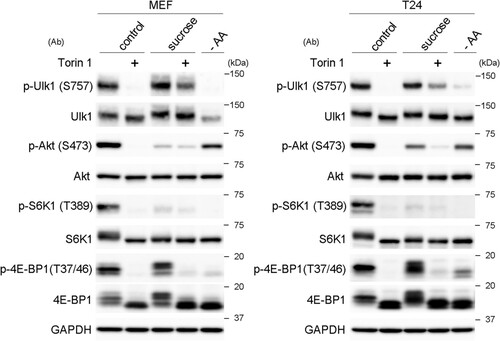
FIG 7 Ulk1 complex does not nucleate under hyperosmotic stress. (A) Wild-type MEFs and T24 cells were cultured in DMEM (control) or amino acid-free DMEM (−AA) for 120 min or with 0.8 M sucrose for 30 min. They were fixed and double immune labeled for WIPI2 (red) and FIP200 (green). The boxed regions are magnified in the insets. The yellow arrowheads indicate puncta double positive for WIPI2/FIP200. Bars, 10 μm. (B) Wild-type MEFs expressing GFP-Ulk1 (green) and T24 cells were cultured as for panel A. They were fixed and immunolabeled for WIPI2 (red) in MEFs and double immunolabeled for Atg16L (red) and Atg13 (green) in T24 cells. The boxed regions are magnified in the insets. The yellow arrowheads indicate puncta double positive for WIPI2/GFP-Ulk1 in MEFs and Atg16L/Atg13 in T24 cells. Bars, 10 μm.
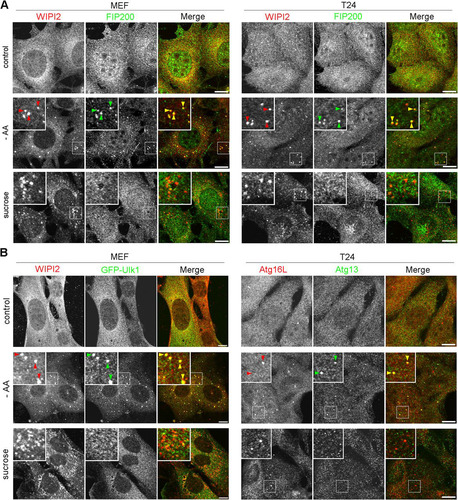
FIG 8 The Ulk1 complex is not essential for hyperosmotic-stress-induced autophagy. (A) FIP200−/− MEFs and Atg13−/− MEFs were cultured in DMEM (control) or amino acid-free DMEM (−AA) for 120 min or with 0.8 M sucrose for 30 min. They were fixed and double immune labeled for WIPI2 (red) and p62 (green). The boxed regions are magnified in the insets. The yellow arrowheads indicate puncta double positive for WIPI2/p62. Bars, 10 μm. (B) FIP200−/− MEFs and Atg13−/− MEFs were cultured with or without 100 nM bafilomycin A1 for 16 h and then with 0.8 M sucrose or 0.4 M NaCl for 1 h or 2 h, as indicated. The lysates were analyzed for Western blotting using antibodies against p62 or GAPDH as a loading control. Molecular weights are indicated on the right. The experiments were repeated 5 times. Band intensities were quantified, and ratios to the control value are plotted on the right. Statistical significance was determined by Student's t test. **, P < 0.01. (C) FIP200−/− MEFs and Atg13−/− MEFs were transfected with mCherry-p62 and then cultured in DMEM (control) or DMEM with 0.8 M sucrose for 1 h. The cells were fixed and immunolabeled for Lamp1. The boxed regions are magnified in the insets. Bars, 10 μm.
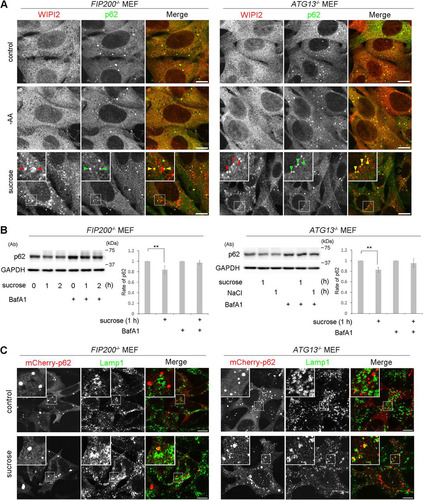
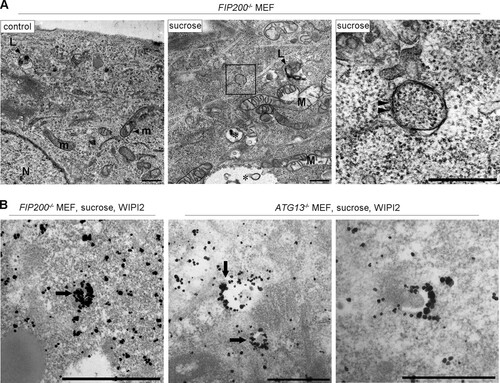
FIG 9 Electron microscopic analyses for autophagosomal structures and WIPI2 localization in FIP200−/− or Atg13−/− MEFs under hyperosmotic stress. (A) FIP200−/− MEFs were cultured in DMEM with or without (control) 0.8 M sucrose for 1 h and then fixed for EM. The boxed region in the middle is shown enlarged on the right. (B) FIP200−/− MEFs and Atg13−/− MEFs were cultured with 0.8 M sucrose for 30 min and then fixed for immuno-EM using anti-WIPI2 antibody. Note that small autophagosome/IM-like profiles with double membranes (panel A, right, arrowheads), and those labeled with silver-enhanced particles indicating WIPI2 were detected. Asterisk, large endosome-like structures; L, lysosome-like profiles; m, mitochondria; M, degenerated mitochondria; N, nucleus. Bars, 0.5 μm.