
Figures & data
FIG 1 Induction of ER stress leads to reduced ECD protein expression in a PERK-eIF2α-dependent manner. (A to C) MCF-10A cells were treated with thapsigargin (Tg; 50 nM) (A) or tunicamycin (Tun; 50 ng/ml) (B), and Panc-1 cells were cultured in a glucose-free medium (C), and then cell lysates were prepared at the indicated time points. Equal amounts of proteins were resolved by SDS-PAGE and then subjected to Western blotting with the indicated antibodies. An increase in the level of p-eIF2α served as a marker for induction of ER stress. (D to F) MCF-10A cells were treated with thapsigargin (D and E) and Panc-1 cells were cultured in glucose-free medium (F), and then total RNA was isolated and subjected to qRT-PCR using CHOP primers and ECD primers. Data are means and standard deviations (SD) for 3 independent experiments *, P < 0.05. CHOP mRNA induction served as a control for thapsigargin-induced ER stress. (G) Wild-type (WT) PERK and PERK kinase domain knockout (PERK-KO) MEFs were treated with thapsigargin (50 nM) for 14 h, and then cell lysates were resolved in SDS-PAGE gels and subjected to Western blotting with the indicated antibodies. (H and I) PERK-KO and control WT MEFs were treated with thapsigargin, and total RNA was isolated at the indicated time points and subjected to qRT-PCR with primers targeting CHOP (H) or ECD (I). (J) WT eIF2α MEFs or mutant eIF2α phosphodeficient MEFs were treated with thapsigargin (Tg; 50 nM) or tunicamycin (Tun; 50 ng/ml) for 14 h, and then cell lysates were analyzed by Western blotting with the indicated antibodies.
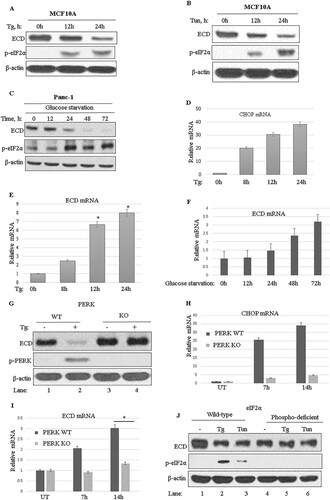
FIG 2 ECD colocalizes and associates with PERK and GRP78. (A to E) Immortal MEFs were fixed in 3% paraformaldehyde (PFA), stained with the indicated antibodies, and mounted for analyses by structured illumination microscopy (SIM). PERK and GRP78 colocalization served as a positive control. DAPI (4′,6-diamidino-2-phenylindole) was used to stain the nucleus. (F) MCF-10A cells were fractionated into soluble and microsomal fractions. The purity of the fractions was assessed by using GAPDH (a marker of the soluble/cytoplasmic fraction), PERK and SERCA (both markers of the microsomal fraction), and RCAS1 (a Golgi-predominant protein) as markers (Citation88). WCL, whole-cell lysate. (G to J) MCF-10A cells were fixed with 3% PFA and stained with the indicated antibodies (all antibodies were generated in rabbits, except for the anti-ECD mouse antibody), followed by species-specific secondary antibodies linked to cDNA probes to allow fluorescent probe-based detection of the PCR amplification products as distinct foci. Incubation with proximity ligation assay plus and minus probes, followed by ligation and amplification, was carried out according to the manufacturer's protocol. Red dots indicate interactions. ECD and PIH1D1 served as positive controls. (K) Lysates of MCF-10A cells, treated with thapsigargin or left untreated, were subjected to IP with anti-ECD antibody (left) or anti-GRP78 (right), followed by Western blotting with the indicated antibodies. ECD and PIH1D1 (left) or GRP78 and PERK (right) served as positive controls.
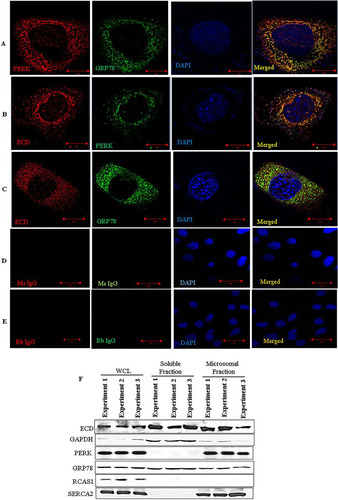
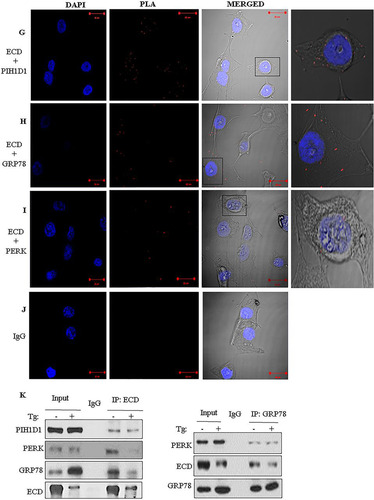
FIG 3 ECD regulates the PERK pathway of the UPR. (A and C) Ecdfl/fl MEFs were infected with an adenovirus coding for GFP (adeno-GFP; control) or Cre (adeno-Cre) for 72 h. The cells were then left untreated or treated with thapsigargin (50 nM). Equal amounts of proteins were resolved in an SDS-PAGE gel and then subjected to Western blotting with the indicated antibodies. (B) After adenovirus infection as described for panel A, the cells were treated with thapsigargin. Total RNA was isolated and subjected to qRT-PCR with CHOP primers. The data are means and SD for 3 independent experiments. *, P < 0.05. (D) After adenovirus infection as described for panel A, equal numbers (1,000) of wild-type (WT) or ECD−/− cells were plated in triplicate and treated with thapsigargin for 24 h. Ten days later, surviving colonies were assessed after crystal blue (0.5% in 25% methanol) staining. The color retained after the wash was dissolved in 10% acetic acid, and the absorbance at 590 nm was read. The graph in the bottom panel represents relative absorbances. The data are means and SD for 4 independent experiments. *, P < 0.05; **, P ≤ 0.002. UT, untreated cells. (E) Panc-1 cells were treated with control or ECD siRNA for 48 h. The cells were then switched to glucose-free medium, and cell lysates were prepared at the indicated time points and subjected to Western blotting with the indicated antibodies. (F, H, and I) ECD-inducible MEFs [Tet(O)-Flag- hECD-IRES-eGFP; rtTA] or control MEFs [Tet(O)-Flag-hECD-IRES-eGFP] were treated with Dox for 48 h, followed by treatment with thapsigargin (50 nM) or tunicamycin (50 ng/ml). Cell lysates were prepared at the indicated time points, and equal amounts of proteins were resolved in an SDS-PAGE gel and subjected to Western blotting with the indicated antibodies. (G) Following ECD induction and thapsigargin treatment as described above, CHOP mRNA levels were assessed using qRT-PCR.
![FIG 3 ECD regulates the PERK pathway of the UPR. (A and C) Ecdfl/fl MEFs were infected with an adenovirus coding for GFP (adeno-GFP; control) or Cre (adeno-Cre) for 72 h. The cells were then left untreated or treated with thapsigargin (50 nM). Equal amounts of proteins were resolved in an SDS-PAGE gel and then subjected to Western blotting with the indicated antibodies. (B) After adenovirus infection as described for panel A, the cells were treated with thapsigargin. Total RNA was isolated and subjected to qRT-PCR with CHOP primers. The data are means and SD for 3 independent experiments. *, P < 0.05. (D) After adenovirus infection as described for panel A, equal numbers (1,000) of wild-type (WT) or ECD−/− cells were plated in triplicate and treated with thapsigargin for 24 h. Ten days later, surviving colonies were assessed after crystal blue (0.5% in 25% methanol) staining. The color retained after the wash was dissolved in 10% acetic acid, and the absorbance at 590 nm was read. The graph in the bottom panel represents relative absorbances. The data are means and SD for 4 independent experiments. *, P < 0.05; **, P ≤ 0.002. UT, untreated cells. (E) Panc-1 cells were treated with control or ECD siRNA for 48 h. The cells were then switched to glucose-free medium, and cell lysates were prepared at the indicated time points and subjected to Western blotting with the indicated antibodies. (F, H, and I) ECD-inducible MEFs [Tet(O)-Flag- hECD-IRES-eGFP; rtTA] or control MEFs [Tet(O)-Flag-hECD-IRES-eGFP] were treated with Dox for 48 h, followed by treatment with thapsigargin (50 nM) or tunicamycin (50 ng/ml). Cell lysates were prepared at the indicated time points, and equal amounts of proteins were resolved in an SDS-PAGE gel and subjected to Western blotting with the indicated antibodies. (G) Following ECD induction and thapsigargin treatment as described above, CHOP mRNA levels were assessed using qRT-PCR.](/cms/asset/9e9377ae-b146-410b-9925-9b3681c60127/tmcb_a_12276335_f0003a_oc.jpg)
![FIG 3 ECD regulates the PERK pathway of the UPR. (A and C) Ecdfl/fl MEFs were infected with an adenovirus coding for GFP (adeno-GFP; control) or Cre (adeno-Cre) for 72 h. The cells were then left untreated or treated with thapsigargin (50 nM). Equal amounts of proteins were resolved in an SDS-PAGE gel and then subjected to Western blotting with the indicated antibodies. (B) After adenovirus infection as described for panel A, the cells were treated with thapsigargin. Total RNA was isolated and subjected to qRT-PCR with CHOP primers. The data are means and SD for 3 independent experiments. *, P < 0.05. (D) After adenovirus infection as described for panel A, equal numbers (1,000) of wild-type (WT) or ECD−/− cells were plated in triplicate and treated with thapsigargin for 24 h. Ten days later, surviving colonies were assessed after crystal blue (0.5% in 25% methanol) staining. The color retained after the wash was dissolved in 10% acetic acid, and the absorbance at 590 nm was read. The graph in the bottom panel represents relative absorbances. The data are means and SD for 4 independent experiments. *, P < 0.05; **, P ≤ 0.002. UT, untreated cells. (E) Panc-1 cells were treated with control or ECD siRNA for 48 h. The cells were then switched to glucose-free medium, and cell lysates were prepared at the indicated time points and subjected to Western blotting with the indicated antibodies. (F, H, and I) ECD-inducible MEFs [Tet(O)-Flag- hECD-IRES-eGFP; rtTA] or control MEFs [Tet(O)-Flag-hECD-IRES-eGFP] were treated with Dox for 48 h, followed by treatment with thapsigargin (50 nM) or tunicamycin (50 ng/ml). Cell lysates were prepared at the indicated time points, and equal amounts of proteins were resolved in an SDS-PAGE gel and subjected to Western blotting with the indicated antibodies. (G) Following ECD induction and thapsigargin treatment as described above, CHOP mRNA levels were assessed using qRT-PCR.](/cms/asset/9b30db8d-5dc9-4f85-846a-54169f62f31c/tmcb_a_12276335_f0003b_oc.jpg)
FIG 4 Increased induction of GRP78 expression is required for ECD to downregulate PERK signaling. (A) Ecdfl/fl MEFs were treated with adenovirus as described in the legend to to , and then the cells were treated with thapsigargin (50 nM). Cell lysates were prepared at the indicated time points. Equal amounts of proteins were resolved in an SDS-PAGE gel and then subjected to Western blotting with the indicated antibodies. (B) ECD was knocked down by use of siRNA (20 nM) in Panc-1 cells, followed by exposure to glucose-free medium, and cell lysates were collected at the indicated time points and subjected to Western blotting with the indicated antibodies. (C and D) Following ECD deletion (C) or ECD overexpression (D) and thapsigargin treatment as described above, the levels of GRP78 mRNA were assessed in WT (control) versus ECD−/− (adeno-Cre treated) or control versus ECD-overexpressing MEFs by use of qRT-PCR. (E) ECD was knocked down in Panc-1 cells, followed by cycloheximide treatment (25 μM). Cell lysates were prepared at the indicated time points and subjected to Western blotting with the indicated antibodies. (F) ECD-inducible MEFs and their control MEFs were treated with Dox as described previously, followed by treatment with thapsigargin and then cycloheximide treatment (25 μM) for the indicated times. Cell lysates were prepared and subjected to Western blotting with the indicated antibodies. (G) ECD-overexpressing MEFs and control MEFs were treated with GRP78 siRNA (30 nM) or control siRNA (scrambled). Twenty-four hours later, the cells were treated with Dox for 48 h to induce ECD overexpression, followed by thapsigargin treatment (50 nM). Equal amounts of proteins were resolved in an SDS-PAGE gel and subjected to Western blotting with the indicated antibodies.
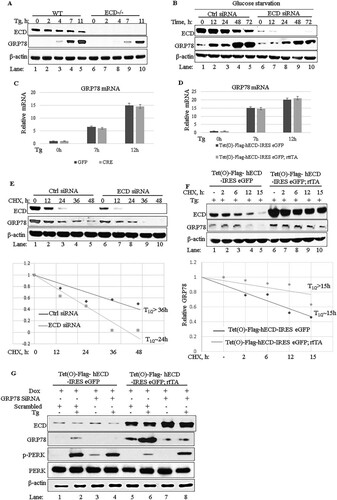
FIG 5 ECD overexpression provides a survival advantage. (A) ECD was induced as described in the legends to and , followed by thapsigargin treatment for 24 h. Equal amounts of proteins were resolved in an SDS-PAGE gel and then subjected to Western blotting with the indicated antibodies. (B) Following ECD induction with Dox and thapsigargin treatment as described above, total RNA was isolated, and CHOP mRNA was assessed by qPCR. The data are means and SD for 3 independent experiments. *, P < 0.05. (C) After ECD induction, control and ECD-inducible MEFs were trypsinized, and equal numbers of cells (1,000) were plated in triplicate. Eight hours later, the cells were treated with thapsigargin for 24 h. Ten days later, surviving colonies were assessed by crystal blue staining (0.5% in 25% methanol). The color retained after the wash was dissolved in 10% acetic acid, and the absorbance at 590 nm was read. The graph at bottom represents relative absorbances. The data are means and SD for 4 independent experiments. **, P ≤ 0.002.
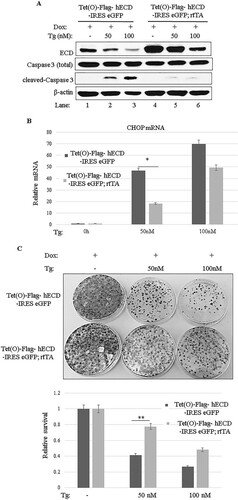
TABLE 1 Primers used for real-time quantitative PCR