Figures & data
FIG 1 mTORC1 signaling is hyperactivated in sarcopenic skeletal muscle. (A) Immunoblots for phosphorylated (p) and total (t) protein for rpS6 in gastrocnemius muscles of rats aged 6, 21, 24, and 27 months (6M, 21M, 24M, and 27M, respectively) (n = 5 to 8). Glyceraldehyde-3-phosphate dehydrogenase (GAPDH) is shown as a protein loading control. (B) p-rpS6(S240/244) protein amounts were quantified relative to the respective total rpS6 protein amounts by densitometry. (C) Gastrocnemius muscle weights in rats aged 6, 9, 12, 18, 21, 24, and 27 months (n = 8 to 12). Data are means ± standard deviations of the means. Statistical significance was determined by a one-way ANOVA followed by Dunnett’s multiple-comparison tests. Means of results from all groups were compared to the mean of results from 12-month-old animals. Asterisks are used to denote significance as follows: **, P < 0.01; ****, P < 0.0001. The y-axis data in panel B represent arbitrary units.
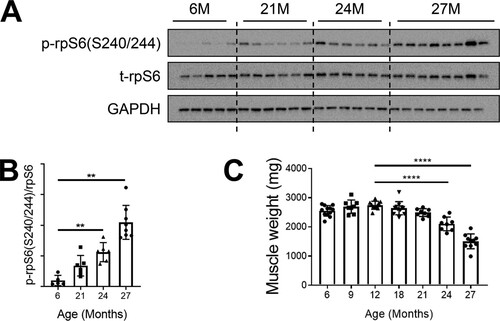
FIG 2 Confirmed mTORC1 inhibition following rapalog treatment. Representative immunoblots are shown for phosphorylated (p) and total (t) protein for S6K1, rpS6, and 4EBP1 in tibialis anterior (A), plantaris (B), and gastrocnemius (C) muscles of 9- and 24-month-old rats treated with vehicle and of 24-month-old rats treated with 0.15 mg/kg (LD) or 0.5 mg/kg (HD) RAD001. Glyceraldehyde-3-phosphate dehydrogenase (GAPDH) is shown as a protein loading control. p-S6K1(T389), p-rpS6(S240/244), and p4EBP1(T37/46) protein amounts were quantified relative to the respective total S6K1, rpS6, and 4EBP1 protein amounts by densitometry (n = 10 to 12 animals per group). Data are means ± standard deviations of the means. y-axis data represent arbitrary units. Asterisks are used to denote significance as follows: *, P < 0.05; **, P < 0.01; ***, P < 0.001; ****, P < 0.0001. Pound signs are used to denote significance as follows: #, P < 0.05 (by unpaired Student's t test).
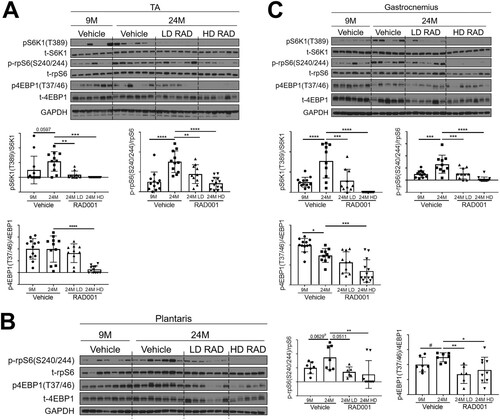
FIG 3 Low-dose RAD001 treatment increases mass of select skeletal muscles. (A) Total body weights of 9- and 24-month-old rats treated with vehicle and 24-month-old rats treated with 0.15 mg/kg (LD) or 0.5 mg/kg (HD) RAD001 (n = 11 to 13 animals per group). (B) Blood glucose levels measured at the end of study (n = 10 to 13 animals per group). (C) Weights of tibialis anterior (TA), plantaris, and gastrocnemius muscles from the animals described in the panel A legend following treatment (n = 6 to 13 animals). Data are means ± standard deviations of the means. Asterisks are used to denote significance as follows: **, P < 0.01; ****, P < 0.0001. Pound signs are used to denote significance as follows: #, P < 0.05 (by unpaired Student’s t test).
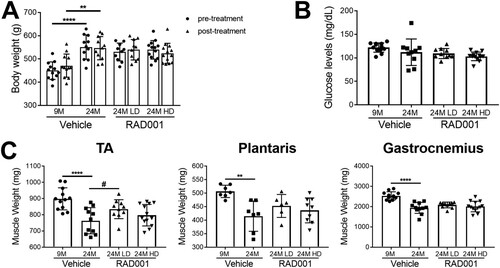
FIG 4 Gene expression of atrophy markers is modulated by rapalog treatment. mRNA amounts are indicated for MuRF1, MaFbx, MT1, and MT2 in tibialis anterior muscles (A), plantaris muscles (B), and gastrocnemius muscles (C) of 9- and 24-month-old rats treated with vehicle and 24-month-old rats treated with 0.15 mg/kg (LD) or 0.5 mg/kg (HD) RAD001 (n = 6 to 13 animals per group). mRNA amounts were standardized to geometric means of results from the TBP gene and the Vps26a gene, used as reference genes in panels. Data are means ± standard deviations of the means. Asterisks are used to denote significance as follows: *, P < 0.05; **, P < 0.01; ***, P < 0.001; ****, P < 0.0001. Pound signs are used to denote significance as follows: #, P < 0.05; ##, P < 0.01 (by unpaired Student’s t test). y-axis data represent arbitrary units.
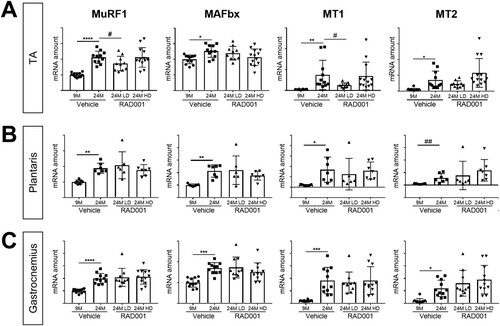
FIG 5 mTORC1 inhibition blunts molecular changes associated with sarcopenia. mRNA amounts are indicated for Cdkn1a and Cdkn2a in tibialis anterior (A), plantaris (B), and gastrocnemius (C) muscles of 9- and 24-month-old rats treated with vehicle and 24-month-old rats treated with 0.15 mg/kg (LD) or 0.5 mg/kg (HD) RAD001 (n = 6 to 13 animals per group). mRNA amounts were standardized to geometric means of results from the TBP gene and the Vps26a gene, used as reference genes. Data are means ± standard deviations of the means. Asterisks are used to denote significance as follows: **, P < 0.01; ***, P < 0.001; ****, P < 0.0001. Pound signs are used to denote significance as follows: #, P < 0.05 (by unpaired Student’s t test). y-axis data represent arbitrary units.
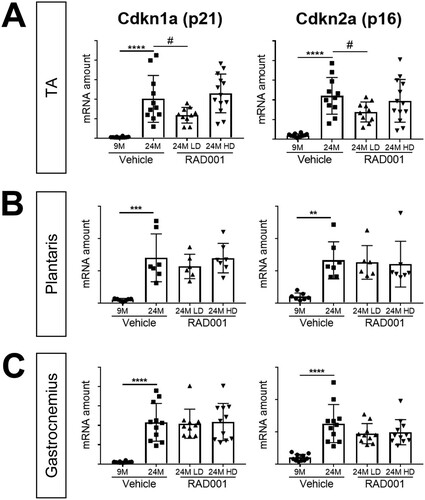
FIG 6 mRNA amounts of denervation markers are reduced by low-dose rapalog treatment. mRNA amounts are indicated for Chrnα1, Chrnε, Musk, MyoG, and Gadd45a in tibialis anterior (A), plantaris (B), and gastrocnemius (C) muscles of 9- and 24-month-old rats treated with vehicle and 24-month-old rats treated with 0.15 mg/kg (LD) or 0.5 mg/kg (HD) RAD001 (n = 6 to 13 animals per group). mRNA amounts were standardized to geometric means of results from the TBP gene and the Vps26a gene, used as reference. Data are means ± standard deviations of the means. Asterisks are used to denote significance as follows: *, P < 0.05; **, P < 0.01; ***, P < 0.001; ****, P < 0.0001. Pound signs are used to denote significance as follows: #, P < 0.05 (by unpaired Student’s t test). y-axis data represent arbitrary units.
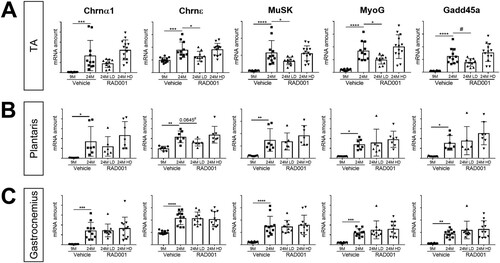
FIG 7 Low-dose rapalog treatment may reestablish autophagy in sarcopenic rats. Representative immunoblots are shown for phosphorylated (p) and total (t) protein for AMPKα, ULK1, and LC3I/II in tibialis anterior (A), plantaris (B), and gastrocnemius (C) muscles of 9- and 24-month-old rats treated with vehicle and 24-month-old rats treated with 0.15 mg/kg (LD) or 0.5 mg/kg (HD) RAD001. Glyceraldehyde-3-phosphate dehydrogenase (GAPDH) is shown as a protein loading control. Phosphorylated protein amounts were quantified relative to the respective total protein amounts by densitometry (n = 6 to 13 animals per group). LC3II protein amounts were quantified as a ratio relative to LC3I protein amounts. Data are means ± standard deviations of the means. Asterisks are used to denote significance as follows: *, P < 0.05; **, P < 0.01; ***, P < 0.001. Pound signs are used to denote significance as follows: #, P < 0.05; ##, P < 0.01 (by unpaired Student’s t test). y-axis data represent arbitrary units.
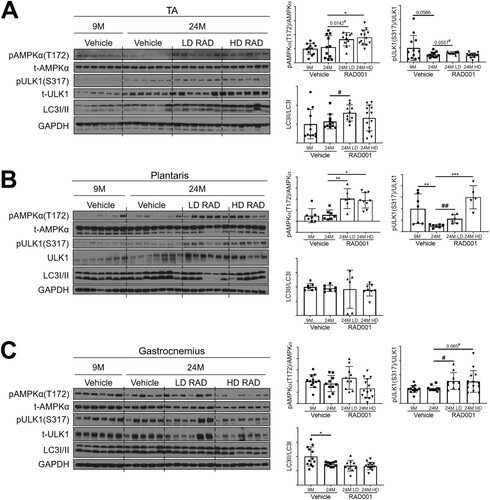
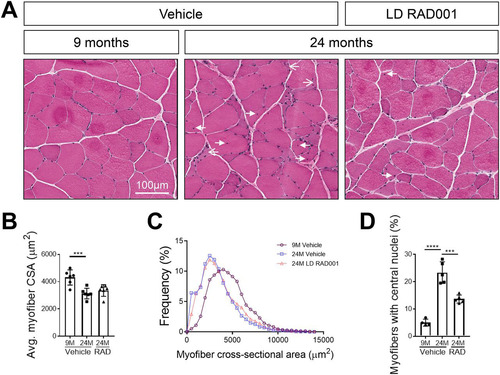
FIG 8 Improved skeletal muscle morphology with low-dose RAD001 treatment. (A) Representative images of transverse sections of plantaris muscles stained with H&E from 9- and 24-month-old rats treated with vehicle (n = 4 and n = 5 animals per group, respectively) and 24-month-old rats treated with 0.15 mg/kg (LD) RAD001 (n = 5 animals). Arrows with open arrowheads indicate misshaped, flattened myofibers. Arrows with filled arrowheads indicate central nuclei. (B) Average myofiber cross-sectional area (CSA) in plantaris muscles (n > 1,200 myofibers assessed per animal). (C) Histogram depicting the distribution of myofiber cross-sectional areas from data shown in panel B. Myofiber cross-sectional area frequencies are shown as a percentage of total myofibers in the given treatment group. (D) Quantification of myofibers with central nuclei in plantaris muscles. Myofibers with central nuclei are shown as a percentage of total myofibers (n > 1,200 myofibers assessed per animal). Data are means ± standard deviations of the means. Asterisks are used to denote significance as follows: ***, P < 0.001; ****, P < 0.0001.