Figures & data
Fig 1 Comparative expression analysis of female wild-type and Smchd1−/− embryos at E10.5. (A) Total RNAs from three female wild-type and three Smchd1−/− embryos were processed individually and hybridized to Affymetrix mouse genome 430 2.0 arrays. A total of 215 probe sets were found to be differentially expressed following data processing (FDR, ≤30%), with 154 up- and 61 downregulated probe sets in Smchd1−/− embryos showing a log2 fold expression change ranging from −3 to +3 and overlapping X-linked and autosomal genes. (B) Scatter plot of normalized expression values (in log2 scale) of 569 X-linked genes in wild-type versus mutant embryos. Three individual genes upregulated in mutant embryos are highlighted in color. (C) Scatter plot of normalized expression values (in log2 scale) of 14,962 autosomal genes in wild-type versus mutant embryos. A number of individual genes that are up- or downregulated in mutant embryos are highlighted in color.
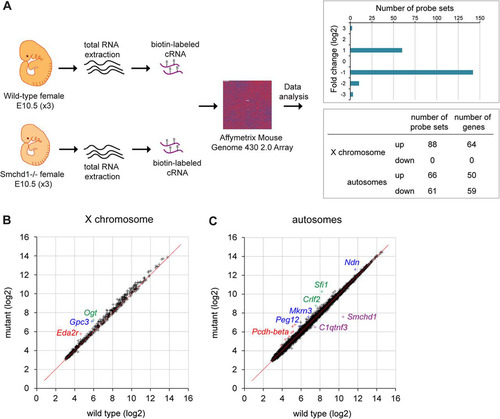
Fig 2 X-linked genes upregulated in mutant embryos are located in clusters, and upregulation can be uncoupled from DNA hypomethylation. (A) Chromosomal locations along the X chromosome of the 88 significantly upregulated probe sets on the array in female Smchd1−/− embryos (red). Gene density (UCSC genes) along the chromosome is shown in blue. The positions of Xist and of the 7 X-linked genes analyzed in panel C are shown, as well as the locations of the three clusters highlighted in the heat maps in panel B (a, b, and c). Cen, centromere. Tel, telomere. (B) Heat maps of fold changes in expression between wild-type and mutant embryos for 3 gene clusters. (C) Expression levels of seven X-linked genes were measured by qPCR after reverse transcription in female (F) wild-type (wt) and Smchd1 mutant (−/−) E10.5 embryos. (D) Expression levels of three X-linked genes were measured by RT-qPCR in wild-type (wt) and Dnmt3b mutant (−/−) E9.5 embryos and directly compared with data obtained for wild-type and Smchd1−/− embryos from panel C. Methylation levels, shown as a reverse histogram, were measured for the Eda2r, Atrx, and Gpc3 CGIs in wt and Dnmt3b−/− E9.5 embryos and wt and Smchd1−/− E10.5 embryos by Sequenom. (E) Expression levels of nine X-linked genes and three autosomal targets were measured by RT-qPCR in female (F) and male (M) wild-type (wt), Dnmt3b+/−, and Dnmt3b−/− E9.5 embryos. Methylation levels, shown as a reverse histogram, were analyzed using bisulfite Sequenom analysis for five genes in female E9.5 wt and Dnmt3b heterozygous and homozygous mutant embryos. For all genes, graphs represent the mean from at least 3 individual embryos ± standard deviation of the mean (except for Dnmt3b E9.5 wt samples, where n = 2). For expression analysis, levels are normalized to housekeeping gene expression. When significant, P values for fold change in expression are indicated (P ≤ 0.05, unpaired Student t test).
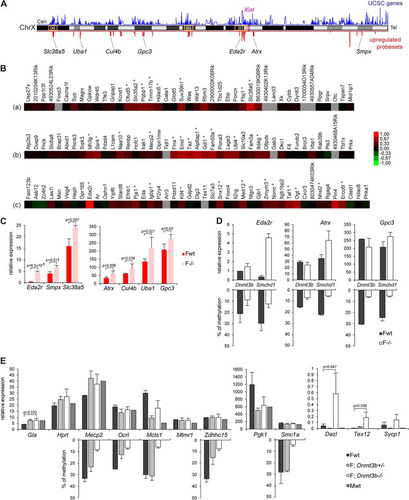
Fig 3 Clustering and genomic sequence feature analyses on the X chromosome. (A) Nonrandom clustering of the differentially expressed genes is illustrated by the median distance between the differentially expressed genes (arrow) compared with the increased median distances of 64 genes randomly selected 1,000 times from the mouse X chromosome. (B) Enrichment for two mouse SINE subtypes in the X-linked clusters is shown by their relative frequencies within the clusters defined by abnormal expression due to the loss of Smchd1, compared with the lower frequencies for the same elements in 1,000 randomly selected regions of equivalent size in the X chromosome.
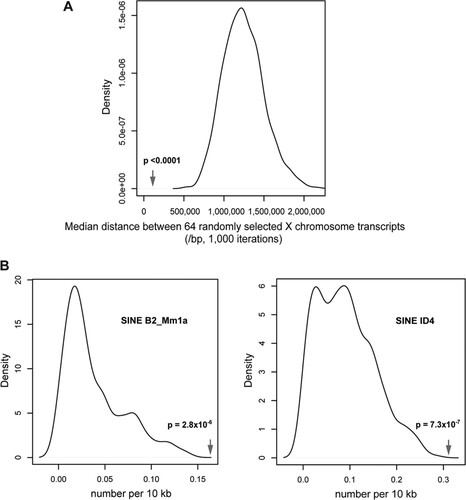
Fig 4 Expression and DNA methylation analysis of candidate targets identified in the array experiment. Expression levels of five upregulated (A) and four downregulated (B) candidate genes were assessed by RT-qPCR in female (F) and male (M) wild-type (wt) and Smchd1 mutant (−/−) embryos at E10.5. For all genes, graphs represent the mean from at least 3 individual embryos ± standard deviation of the mean. Expression levels are normalized to housekeeping gene expression. When significant, P values for fold change in expression are indicated (P ≤ 0.05, unpaired Student t test). (C) Methylation levels of the CGIs linked to four candidate genes (all upregulated in the microarray experiment) were measured using bisulfite Sequenom analysis. A schematic map of a 3.5-kb genomic region around the transcription start site (arrows) with CGIs (gray boxes) for each gene is shown on the left. Blue rectangles represent coding sequences. Vertical bars indicate the positions of CpG sites, and the line linking by two green rectangles at the bottom indicates the position of the fragment analyzed by Sequenom. Graphs on the right indicate methylation levels calculated from an average of 3 independent embryos from each sex and each genotype. Error bars represent standard deviations.
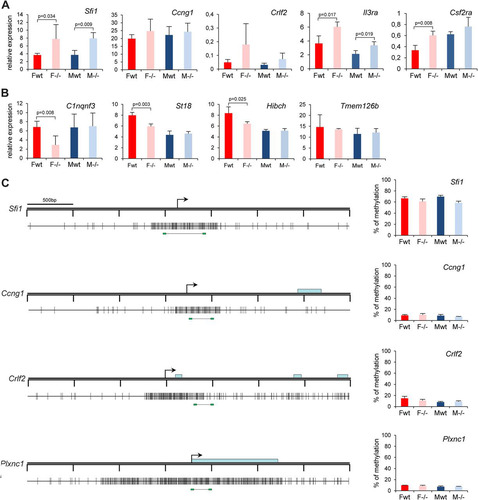
Fig 5 Imprinted genes from the PWS region are reactivated on the maternal allele in Smchd1−/− embryos. (A) Schematic diagram of the PWS region located on chromosome 7C in the mouse. The imprinted genes analyzed cluster in a region of 116 kb, while Snurf/Snprn, which comprises the imprinting control region (ICR), is located 2 Mb upstream. Arrows indicate the direction of transcription of each gene. CpG islands (CGIs) are shown as green boxes, and the ICR is shown as a black box. Cen, centromere. Tel, telomere. (B) Expression levels of the four clustered PWS genes Ndn, Magel2, Mkrn3, and Peg12, plus Snrpn, were measured by RT-qPCR in female (F) and male (M) wild-type (wt) and mutant (−/−) embryos at E10.5. For all genes, graphs represent the mean from at least 3 individual embryos ± standard deviation of the mean. Expression levels are normalized to housekeeping gene expression. When significant, P values for fold change in expression are indicated (P ≤ 0.05, unpaired Student t test). (C) Conventional sequencing analysis of RT-PCR products centered on FVB/DBA SNPs found in the four clustered genes was performed for wild-type and Smchd1−/− embryos at E10.5. Chromatograms are shown for each gene, with SNP position (arrow) and coordinate underneath, and indicate that the DBA paternal allele is expressed only in the wild type, whereas both alleles are expressed in Smchd1−/− embryos. The same results were obtained for 3 individual embryos from each sex and genotype.
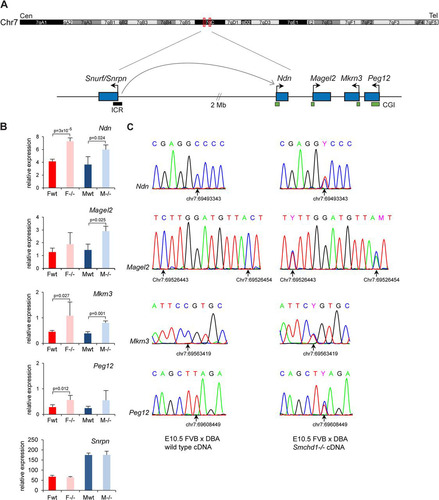
Fig 6 The clustered PWS genes are hypomethylated in Smchd1−/− embryos. (A) Methylation analysis by Sequenom of fragments encompassing the CGIs linked to genes from the PWS cluster. A schematic map of a 2-kb genomic region around the transcription start site (arrows) with CpG islands (gray boxes) for each gene is shown on the left. Blue rectangles represent coding sequences. Vertical bars indicate the positions of CpG sites, and the line linking two green rectangles at the bottom indicates the position of the fragment analyzed by Sequenom. For Peg12, arrowheads represent primers used for conventional bisulfite in panel B. Graphs on the right indicate methylation levels calculated from an average of three E10.5 embryos from each sex (F, female; M, male) and genotype (wt, wild type; −/−, Smchd1 mutant). Error bars represent standard deviations. (B) Conventional bisulfite analysis of the Peg12 CGI in wild-type and Smchd1−/− male FVB/DBA embryos at E10.5. Circles represent CpG sites either unmethylated (open) or methylated (closed), and global methylation levels are indicated on the right for each allele and each sample analyzed. (C) Average methylation levels measured by bisulfite analysis using Sequenom from 3 individual male wild-type and −/− embryos at E6.5. Error bars represent standard deviations. (D) Methylation levels measured in brain and spleen tissues from wild-type and Smchd1−/− adult males (XY).
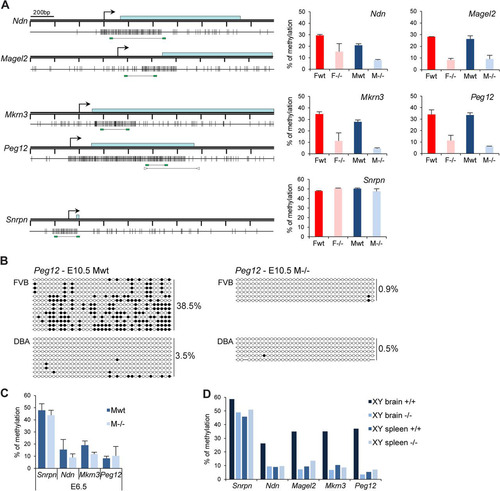
Fig 7 Germ line and somatic DMR methylation is generally unaffected in Smchd1−/− embryos. (A) Methylation levels analysis using Sequenom for a number of germ line and somatic differentially methylated regions (DMRs) in female (F) and male (M) wt and −/− E10.5 embryos. Significant P values are indicated for the Cdkn1c DMR (P ≤ 0.05, unpaired Student t test). (B) Expression levels of the Cdkn1c gene in female and male wt and −/− E10.5 embryos. (C) Analysis of the methylation levels of the Cdkn1c somatic DMR at E6.5. Graphs represent an average from 3 independent embryos at E10.5 and E6.5 ± standard deviation. For expression analysis, levels are normalized to housekeeping gene expression.
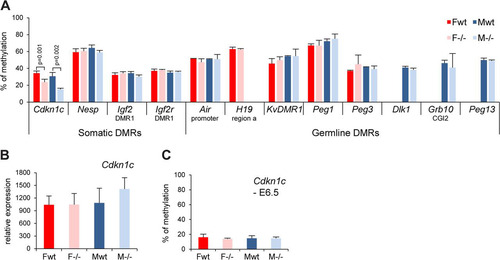
Fig 8 Genes from the Pcdh-alpha and Pcdh-beta clusters are upregulated in Smchd1−/− embryos. (A) Schematic diagram of the Pcdha and Pcdhb gene clusters covering a region of 600 kb on chromosome 18 in the mouse. The Pcdha cluster is composed of 12 variable-region exons (1 to 12) showing combinatorial and monoallelic expression, 2 variable-region exons (C1 and C2), and 3 constant-region exons (E2 to -4), constitutively and biallelically expressed in single neurons. The Pcdhb cluster is composed of 22 individual genes, for which the allelic pattern of expression in single cells is not known. Cen, centromere. Tel, telomere. (B and C) Expression levels of several Pcdha exons (B) and Pcdhb genes (C) were measured by RT-qPCR in female (F) and male (M) wild-type (wt) and mutant (−/−) embryos at E10.5. For all genes, graphs represent the mean from 3 or 4 individual embryos ± standard deviation of the mean. Expression levels are normalized to housekeeping gene expression. When significant, P values for expression fold change are indicated (P ≤ 0.05, unpaired Student t test).
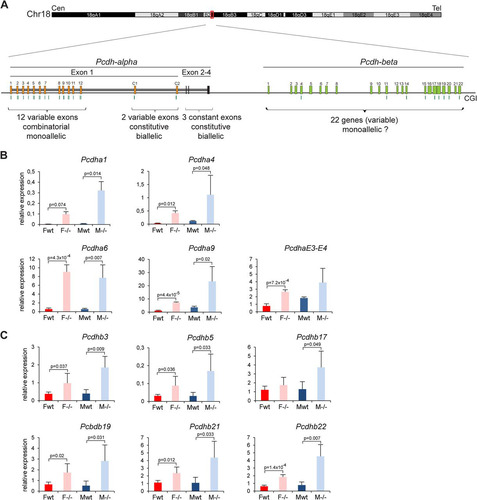
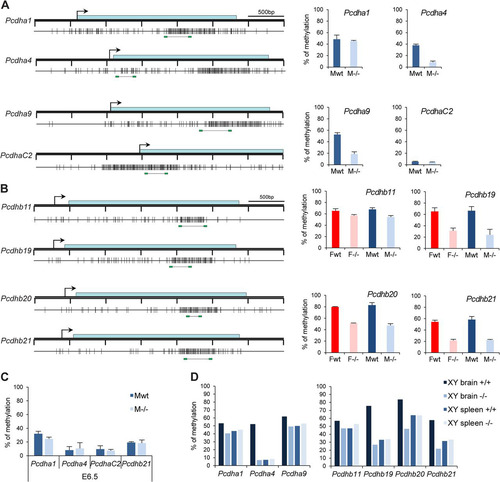
Fig 9 Hypomethylation of Pcdh-linked CGI in Smchd1−/− embryos. (A and B) Methylation analysis by Sequenom of fragments encompassing the CGIs linked to genes from the Pcdha (A) and Pcdhb (B) cluster. A schematic map of a 3.5-kb genomic region around the transcription start site (arrows) with CGIs (gray boxes) for each gene is shown on the left. Blue rectangles represent coding sequences. Vertical bars indicate the positions of CpG sites, and the line linking two green rectangles at the bottom indicates the position of the fragment analyzed by Sequenom. Graphs on the right indicate methylation levels calculated from an average of 3 independent E10.5 embryos from each sex (F, female; M, male) and genotype (wt, wild type; −/−, mutant). Error bars represent standard deviations. (C) Average methylation levels measured by bisulfite analysis using Sequenom from 3 individual male wild-type and −/− embryos at E6.5. Error bars represent standard deviations. (D) Methylation levels measured in brain and spleen tissues from wild-type and Smchd1−/− adult males (XY).