Figures & data
FIG 1 Generation of the reporter alleles. (a) Map of the Xist/Tsix locus showing the design of the reporter cell lines. (b) Exemplary pictures of undifferentiated and differentiated cells.
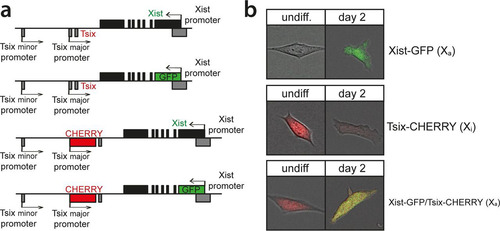
FIG 2 Xist and Tsix reporter lines reveal antagonistic roles for Xist and Tsix. (a) Histograms of EGFP and mCherry FI distributions as determined by FACS analysis. Days 0 through 9 of differentiation are depicted for Xist-GFP, Tsix-CHERRY, and Xist-GFP/Tsix-CHERRY cells. (b and c) Histograms of EGFP (b) and mCherry (c) FI distributions as determined by FACS analysis. Black outlines represent the undifferentiated Xist-GFP single-knock-in cell line (b) and the Tsix-CHERRY single-knock-in cell line at day 4 of differentiation (c). Solid colors represent FI distributions for Xist-GFP/Tsix-CHERRY. (d) Quantification of two-color RNA FISH to detect Xist and Tsix transcripts at different time points of differentiation. The proportion of cells with an Xist cloud, identifying Xi and a Tsix pinpoint from Xa, is shown. The top right panel shows the exon-intron structure of Xist, and gray bars indicate the deleted region of the respective deletion lines. Error bars indicate 95% confidence intervals (n > 150 for all time points and cell lines). Asterisks indicate a P value of <0.05 (*) or a P value of <0.1 (**) by a two-proportion z test. (e) Xist/Tsix two-color RNA FISH of wild-type and Xist-GFP cells. The green probe detects Xist and Tsix, and the red probe detects only Tsix. Xi is identified by the presence of a Xist cloud, and Tsix transcription from Xa is indicated by the presence of a separate two-color pinpoint in the same nucleus.
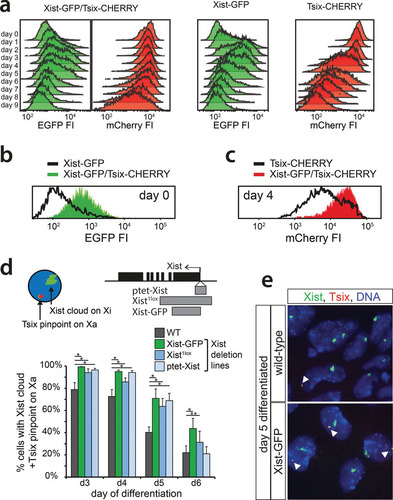
FIG 3 Time-lapse imaging of live cells. (a) Exemplary pictures of Xist-GFP/Tsix-CHERRY cells (top) and Xist-GFP/Tsix-CHERRY+mTagBFP2-Ezh2 cells (bottom) taken at different time points of differentiation during time-lapse imaging. Bars, 5 μm. (b) Whole-cell integrated FI values for EGFP (green) and mCherry (red) plotted over time for several exemplary cells during time-lapse imaging. (c) Linear regression of FI over time for each cell cycle. The slope of the linear regression as a proxy for promoter activity is plotted. Values for EGFP FIs are binned into low (lowest tercile), medium (intermediate tercile), and high (highest tercile), and the corresponding values for mCherry are plotted next to these values. (d) Quantification of the presence of the mTagBFP2-Ezh2 focus/Xi domain and/or high levels of EGFP at different time points of differentiation in Xist-GFP/Tsix-CHERRY+mTagBFP2-Ezh2 cells. Error bars indicate 95% confidence intervals (n = 162 for 48 h, n = 215 for 60 h, and n = 277 for 72 h). (e) Day 2 and day 3 differentiating Xist-GFP/Tsix-CHERRY cells were FACS sorted into EGFP-low, -intermediate, -high, and -very-high fractions. Graphs show quantification of Xist RNA FISH in these fractions. The number on top of each fraction represents the relative abundance within the population before sorting. Error bars indicate 95% confidence intervals (n > 250 for all time points and fractions). (f) Pedigree of an exemplary cell monitored through four cell divisions. (Top) The slope of the linear regression as described above for panel c is shown for EGFP FI. (Bottom) Slope of the linear regression for mCherry. The same-colored dots represent the same cell and thus indicate values for EGFP in the top panel and mCherry in the bottom panel. Arrows connecting dots indicate a mother cell-to-daughter cell relationship. Asterisks in panels d and e indicate a P value of <0.05, as calculated by a chi-square test.
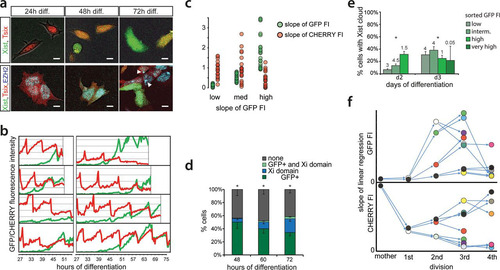
FIG 4 Impact of the RNF12-REX1 regulatory network on Xic regulation. (a) Contour plots data from FACS analysis showing EGFP and mCherry FIs at different time points of differentiation for Xist-GFP/Tsix-CHERRY (XX), Xist-GFP/Tsix-CHERRY+Rex1 (+Rex1), and Xist-GFP/Tsix-CHERRY+Rnf12 (+Rnf12) cells. For all experiments, 100,000 cells were analyzed per time point. Starting from the outermost contour, lines represent 7.5%, 22.5%, 37.5%, 52.5%, 67.5%, and 82.5% of the total events (logarithmic scale). (b) Same as panel a but with mean FIs for EGFP and mCherry plotted (linear scale). (c) Contour plots of data from FACS analysis showing EGFP and mCherry FIs at different time points of differentiation for the XGTC-XO (top) and XY Tsix-CHERRY (bottom) lines. Starting from the outermost contour, lines represent 7.5%, 22.5%, 37.5%, 52.5%, 67.5%, and 82.5% of the total events (logarithmic scale). (d) Same as panel d but with mean FIs for EGFP and mCherry plotted for the XGTC-XO line (linear scale). (e) Contour plots of data from FACS analysis showing EGFP and mCherry FIs in undifferentiated Xist-GFP/Tsix-CHERRY (XX) cells and for clones 2, 3, and 43 of Xist-GFP/Tsix-CHERRY Rnf12+/− ES cell lines. Starting from the outermost contour, lines represent 7.5%, 22.5%, 37.5%, 52.5%, 67.5%, and 82.5% of the total events (logarithmic scale).
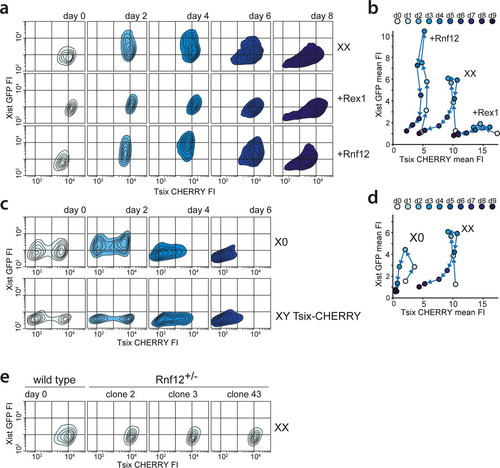
FIG 5 Two stable states of Xic in XO cells. (a) Contour plots of data from FACS analysis showing EGFP and mCherry FIs for the XGTC-XO line. The top panel depicts the original population with a bimodal mCherry distribution, and at the bottom, the sorted mCherry-low and -high populations (as indicated by red-outlined boxes and arrows) are shown directly after the sort, 14 days after the sort, and upon differentiation. Starting from the outermost contour, lines represent 7.5%, 22.5%, 37.5%, 52.5%, 67.5%, and 82.5% of the total events. (b) XGTC-XO ES cell clones after single-cell plating. (c) Expression levels of genes located in Xic as determined by RNA sequencing of XGTC-XO mCherry-low and -high populations. At the top is the location of genes along the X chromosome, and bars show log2(fragments per kilobase per million [FPKM] mCherry-low/FPKM mCherry-high) values. (d) Contour plots of data from FACS analysis showing EGFP and mCherry FIs for the XY Tsix-CHERRY ES line grown under serum-plus-LIF (top) (as shown in ) and 2i+LIF (bottom) conditions, prior to and at different time points after differentiation.
![FIG 5 Two stable states of Xic in XO cells. (a) Contour plots of data from FACS analysis showing EGFP and mCherry FIs for the XGTC-XO line. The top panel depicts the original population with a bimodal mCherry distribution, and at the bottom, the sorted mCherry-low and -high populations (as indicated by red-outlined boxes and arrows) are shown directly after the sort, 14 days after the sort, and upon differentiation. Starting from the outermost contour, lines represent 7.5%, 22.5%, 37.5%, 52.5%, 67.5%, and 82.5% of the total events. (b) XGTC-XO ES cell clones after single-cell plating. (c) Expression levels of genes located in Xic as determined by RNA sequencing of XGTC-XO mCherry-low and -high populations. At the top is the location of genes along the X chromosome, and bars show log2(fragments per kilobase per million [FPKM] mCherry-low/FPKM mCherry-high) values. (d) Contour plots of data from FACS analysis showing EGFP and mCherry FIs for the XY Tsix-CHERRY ES line grown under serum-plus-LIF (top) (as shown in Fig. 4c) and 2i+LIF (bottom) conditions, prior to and at different time points after differentiation.](/cms/asset/24294a2d-b608-4dbe-b287-1db2848e6d93/tmcb_a_12276081_f0005.jpg)
FIG 6 Two stable states of Xic predict XCI potential in XX cells. (a) Contour plots of data from FACS analysis showing EGFP and mCherry FIs for the Xist-GFP/Tsix-CHERRY ES cell line grown in 2i+LIF. The top panel depicts the original population with a bimodal mCherry distribution, and at the bottom, the sorted mCherry-low and -high populations (as indicated by the red-outlined boxes and arrows) are shown directly after the sort, 14 days after the sort, and upon differentiation. Starting from the outermost contour, lines represent 7.5%, 22.5%, 37.5%, 52.5%, 67.5%, and 82.5% of the total events. (b) Quantification of Xist RNA FISH in female Xist-GFP/Tsix-CHERRY cells at day 2 of differentiation after sorting of mCherry-low and -high populations. Error bars indicate 95% confidence intervals (n = 313 for mCherry-low and n = 305 for mCherry-high populations). The asterisk indicates a P value of <0.05 by a two-proportion z test. (c) Allele-specific RNA expression analysis by RNA sequencing. Shown are the FPKM values and allele-specific expression ratios (green, 129/Sv; shading, Cast). (d) Contour plots of 2i+LIF mCherry-high and -low Xist-GFP/Tsix-CHERRY ES cell populations 14 days after a change from 2i+LIF to serum-plus-LIF conditions (top) and 2 days later after the start of differentiation. (e) Expression levels of genes located in Xic as determined by RNA sequencing of 2i+LIF Xist-GFP/Tsix-CHERRY mCherry-low and -high populations. At the top is the location of genes along the X chromosome, and bars show log2(FPKM mCherry-low/FPKM mCherry-high) values. (f) Contour plots of data from FACS analysis showing EGFP and mCherry FIs at different time points of differentiation for Xist-GFP/Tsix-CHERRY (XX), Xist-GFP/Tsix-CHERRY+Rex1 (+Rex1), and Xist-GFP/Tsix-CHERRY+Rnf12 (+Rnf12) ES cells grown under 2i+LIF conditions. Starting from the outermost contour, lines represent 7.5%, 22.5%, 37.5%, 52.5%, 67.5%, and 82.5% of the total events. (g) Same as panel f but with mean FIs for EGFP and mCherry plotted.
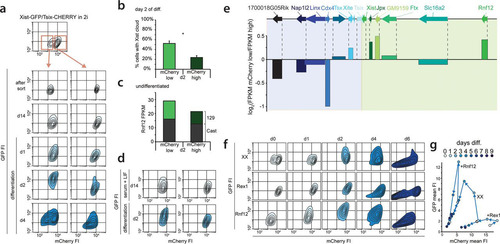
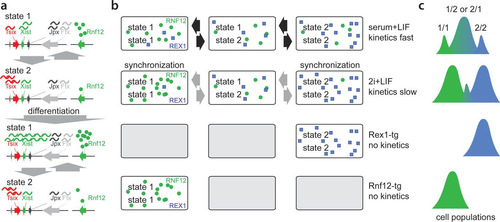
FIG 7 Model for dynamics of Xic transcriptional states. (a) Xic can adopt two distinct transcriptional states. State 1 is permissive whereas state 2 is refractive to Xist upregulation upon differentiation. (b) Under serum-plus-LIF conditions, female XX ES cells show rapid switching between different states, whereas under 2i+LIF conditions, state-switching dynamics are reduced, leading to synchronization of states. Rex and Rnf12 overexpression forces cells to adopt one single transcriptional state. (c) Relative quantity of alleles adopting distinct combinations of transcriptional states.