Figures & data
TABLE 1 siRNA sequences
FIG 1 Interaction of USP28 with 53BP1 and its recruitment to DSBs is dependent on the tandem BRCT domains of 53BP1. (A) HA tag alone or HA-tagged derivatives of 53BP1 (BRCT and CΔBRCT) were expressed in HEK293 cells and immunoprecipitated using HA-agarose. Western blots were probed for the endogenous USP28. (B) siRNA against the 3′ UTR of 53BP1 leads to efficient depletion of the endogenous protein. (C) U2OS cells stably expressing GFP-tagged 53BP1, either the WT or the protein lacking the tandem BRCTs (ΔBRCT), were depleted of the endogenous protein by using siRNA directed against the 3′ UTR. Proteins precipitated using GFP-agarose were assayed for presence of endogenous USP28. (D) Recruitment of endogenous USP28 in U2OS cells stably expressing GFP-53BP1, WT and ΔBRCT, and depleted for the endogenous 53BP1 by using the 3′ UTR siRNA.
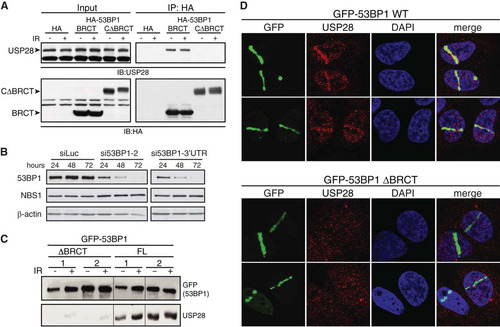
FIG 2 USP28 depletion has minor effects on the dynamics of DDR factors at IRIF. (A) FRAP analysis of GFP-MDC1 in U2OS cells stably expressing the fusion protein transfected with either siLuc (n = 13) or siUSP28 (n = 21). (B) FRAP analysis of GFP-53BP1 in U2OS cells stably expressing GFP-53BP1 transfected with either siLuc (n = 16) or siUSP28 (n = 15). Error bars represent standard deviations. (C to H) Quantification of IRIF numbers via use of antibodies against 53BP1, γH2AX, or conjugated ubiquitin adducts (FK2) following treatment of RPE-1 cells (C, D, and E) or MEFs (F, G, and H) of the indicated genotypes with 2 Gy of IR, viewed with an Opera microscope. MEF data represent the averages of 2 experiments, each using 2 littermate pairs of WT and Usp28-deficient MEFs.
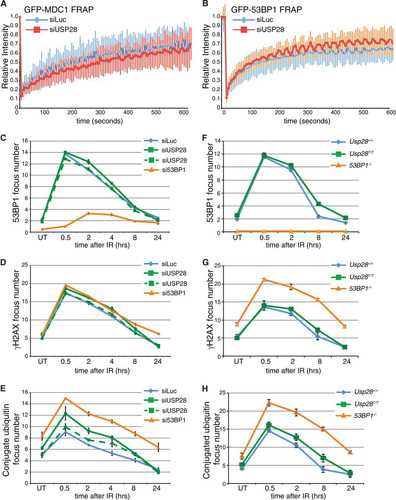
FIG 3 Normal DNA damage-signaling and checkpoint responses in USP28-depleted cells. Western blotting of 2 or 10 Gy IR-treated (A) or camptothecin-treated (CPT at 1 μM for 1 h) (B) U2OS cells at the indicated time points. Cells were transfected with siRNAs for luciferase (siLuc) or USP28. Western blotting results for MEFs treated with 5 Gy IR (C) or 10 J/m2 UV-C (D) at the indicated time points are shown. (E) The G1 checkpoint was intact in RPE-1 cells depleted of siRNA for USP28 or 53BP1 but not ATM. (F) G2/M checkpoint responses were normal in MEFs lacking USP28.
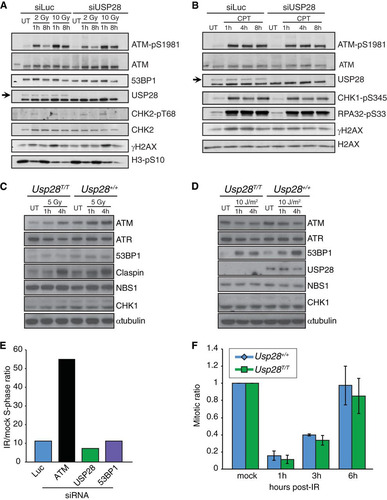
FIG 4 Normal DNA damage sensitivity, DNA repair kinetics, and genome stability in cells depleted for USP28. (A to D) Colony formation assays using U2OS cells transfected with indicated siRNAs (A and B) or MEFs of the indicated genotypes (C and D) were conducted, with cells treated with the indicated doses of IR, camptothecin (CPT), or UV-C. (E) Comet assay results in U2OS cells transfected with siLuc, siMRE11, or two different siRNAs to USP28; the tail moment ratios between repaired and untreated cells are indicated. (F) Efficiency of homologous recombination in a U2OS-based TLR cell line transfected with siLuc, siCtIP, or two different siRNAs to USP28. Values were normalized to the proportion of S/G2 phase cells. (G) Analysis of metaphase aberrations from early-passage MEFs that were mock treated or treated with aphidicolin (300 nM) for 24 h.
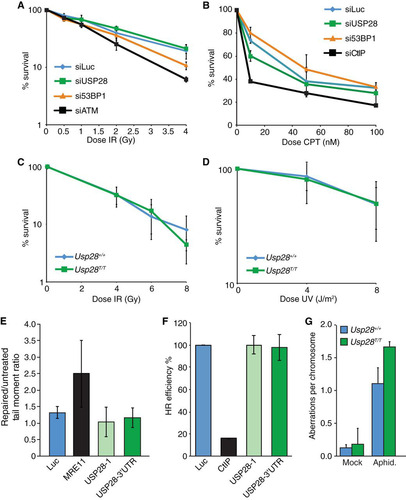
FIG 5 Physiological end-joining processes dependent on ATM and 53BP1 are unaffected by USP28 deficiency. (A) The number of thymocytes in dissected thymi from mice of the indicated genotypes. Results were pooled from multiple WT (n = 6) and Usp28T/T mice (n = 7). (B) Distribution of thymocyte populations from 2-month-old mice of the indicated genotypes (n = 2 for each genotype). CD3-positive cells were stained for CD4 and CD8, and percentages were determined by flow cytometry. DN or DP indicates cells double negative or double positive for CD4 and CD8. (C) Examples of the primary flow cytometry data plotted in panel B. (D) Nested PCR analysis of expected TCRγ and TCRβ loci junction products or transrearrangements between loci in WT (lanes 1) or Usp28T/T (lanes 2) thymocytes. Results for a water control are shown in lanes 3. (E and F) The splenic weight (E) and cell number (F) in WT (n = 6) and Usp28T/T-deficient (n = 7) mice. (G) Class switching to IgG1 in vitro following LPS or IL-4 stimulation (n = 3 for each genotype). (H) Examples of the primary data plotted in panel G, showing CFSE staining to monitor proliferation. (I to K) ELISA measurements of IgG1 (I), IgG2b (J), and IgE (K) levels from animals of the indicated genotype injected with TNP-KLH at days 0 and 41. Each data point is the average for 3 animals, with the standard deviation plotted.
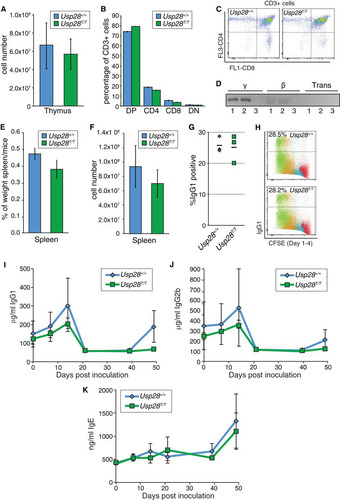
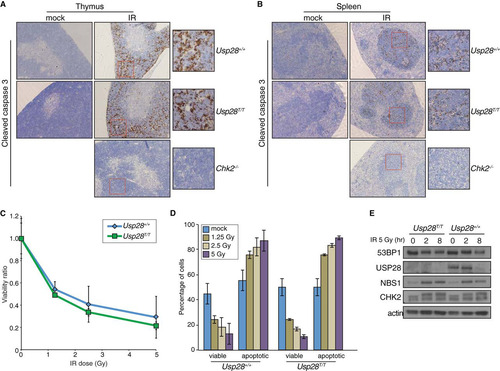
FIG 6 Apoptosis in response to IR is not affected by loss of USP28. (A and B) IHC staining of the thymi (A) or spleens (B) of mice of the indicated genotypes with an antibody for cleaved caspase 3 after mock or IR treatment. (C and D). Ex vivo analysis of thymocyte viability after exposure to a range of IR doses. The ratio of viable (double negative for PI and annexin V) cells relative to the mock treated group are plotted on the curve (C), and the absolute percentages of viable or apoptotic cells are graphed for the indicated genotypes (D). (E) Western blot results for 53BP1, USP28, NBS1, and CHK2 following IR treatment of B lymphocytes. Actin served as a loading control.