
Figures & data
FIG 1 Individuals homozygous for the ADAT3-V144M mutation exhibit similar levels of ADAT3 expression. (A and B) Pedigrees of patient 1 (P1) and P2 containing homozygous V144M missense mutations in the ADAT3 gene. Male family members are denoted by squares, females are denoted by circles, individuals of unknown sex are denoted by diamonds, deceased individuals are denoted by slashes, ID-affected individuals with homozygous V144M mutations are denoted by shading, and consanguinity is denoted by double solid or shaded lines. (C) Immunoblot for the indicated proteins of extracts from LCLs donated from a wild-type (WT) individual and P1 and P2 harboring homozygous V144M mutations.
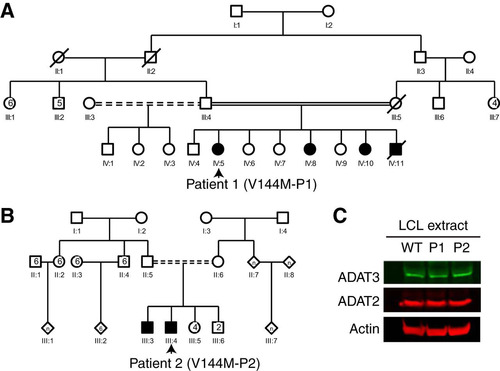
FIG 2 ID-affected individuals expressing only the ADAT3-V144M variant exhibit decreased wobble inosine modification in tRNA isoacceptors. (A) Comparison of tRNA modification levels between V144M- and WT-LCLs. Nucleosides from digested tRNA samples were analyzed by LC-MS. The y axis represents the log2 fold change in the levels of the indicated tRNA modifications between the two patients harboring homozygous V144M mutations described in the legend of and two WT individuals. (B) Inosine modification levels in total tRNA from LCLs of two WT individuals and P1 and P2 harboring homozygous V144M mutations. Inosine levels were measured by absolute quantification to calculate the number of inosines per 1,000 nucleotides. The means and error bars represent measurements from 3 independent RNA samples from each cell line. *, P < 0.05.
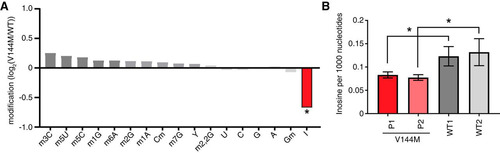
FIG 3 ID-affected individuals expressing only the ADAT3-V144M mutant exhibit a reduction in wobble inosine modification in tRNA isoacceptors. (A) Sequencing chromatogram analysis of RT-PCR products amplified from endogenous tRNA-Val-AAC isolated from LCLs of the indicated individuals. The wobble adenosine/inosine position is highlighted in gray. Inosine is read out as G. (B, D, and E) V144M-LCLs exhibit decreased inosine modification in tRNA-Ile-AAU, -Val-AAC, and -Leu-AAG. Primer extension analysis was performed with the indicated oligonucleotide probes against inosine-containing tRNAs in the presence of ddCTP. “Gn” denotes a readthrough product indicative of decreased inosine modification at position 34. “I34” represents the stop position if inosine is present. “o” represents the labeled oligonucleotide used for primer extension. (−) control represents a primer extension reaction without the addition of reverse transcriptase. (C) Quantification of primer extension for tRNA-Ile-AAU. The RT stop signal due to inosine modification and the G31 readthrough product are plotted as a fraction of the total signal intensity for both bands.
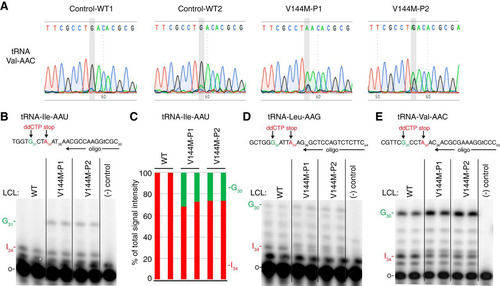
FIG 4 Individuals homozygous for the ADAT3-V144M mutation exhibit defects in adenosine deaminase activity. (A) Representative time course assay of adenosine deaminase activity using human cellular extracts and mature tRNA-Val-AAC from 5 to 45 min. (B and C) Quantification of m1A or IMP formation as a function of time for the indicated cellular extracts prepared from human LCLs. Percent m1A or IMP formation represents either the m1A/AMP+m1A+IMP or the IMP/AMP+m1A+IMP signal (n = 3).
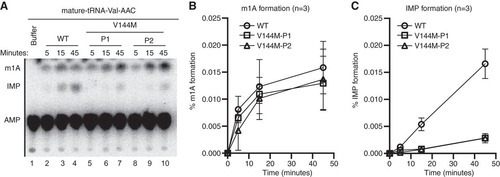
FIG 5 Purified ADAT2/3 complexes assembled with ADAT3-V144M exhibit defects in adenosine deaminase activity. (A) Immunoprecipitation (IP) of endogenous ADAT3. The input represents 4% of the starting extract used for IP. Arrows denote migration of ADAT3 and IgG. (B) ADAT3-V144M retains interaction with ADAT2. Shown are immunoblots for the indicated proteins from the input (5%) or biotin elutions of Strep-Tactin affinity purifications (10%) from HEK 293T cells transfected to express the Strep-tag alone (vector) or Strep-tagged ADAT2 with either GFP-ADAT3-WT or -V144M. “relative ADAT3 copurified” represents the ratio of the GFP-ADAT3 signal present in the eluted fraction normalized to the Strep-ADAT2 signal relative to ADAT3-WT. (C) ADAT3-WT and ADAT3-V144M copurify with similar levels of ADAT2. Shown are immunoblots for the indicated proteins from the input (5%) or biotin elutions from Strep-Tactin affinity purifications (20%) from HEK 293T cells transfected to express ADAT3-Strep-WT or ADAT3-Strep-V144M without or with His-ADAT2. “relative ADAT2 copurified” represents the ratio of the His-ADAT2 signal present in the eluted fraction normalized to the ADAT3-Strep signal relative to ADAT3-WT. Experiments for panels A through C were repeated three times, with comparable results.
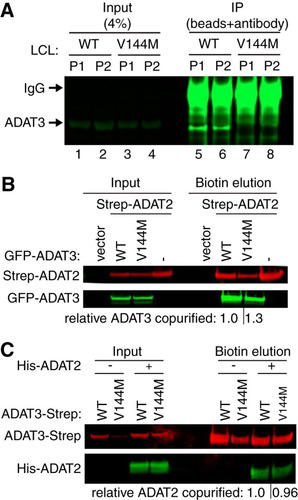
FIG 6 Purified ADAT2/3 complexes assembled with ADAT3-V144M exhibit defects in adenosine deaminase activity. (A) Schematic of the adenosine deaminase assay for inosine formation using in vitro-transcribed tRNA-Val-AAC. After incubation with ADAT2/3, labeled tRNA was digested with P1 nuclease, followed by separation of adenosine (A) from inosine (I) by thin-layer chromatography (TLC). (B) Immunoblot of purified ADAT2/3 complexes with 2-fold dilution series. The blot was probed for ADAT3-Strep and His-ADAT2. (C) Representative phosphorimager scan of TLC-separated nucleoside products from tRNAs incubated with buffer (−) or ADAT2/3 for the indicated times. The migration of IMP and AMP is indicated. (D) Quantification of IMP formation as a function of time for the indicated ADAT2/3 enzymes. Percent IMP formation represents the IMP/AMP plus IMP signal (n = 3).
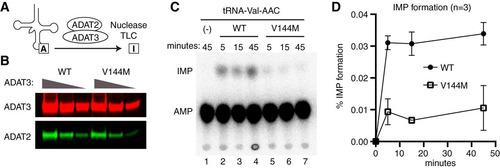
FIG 7 ADAT3-V144M exhibits an increased propensity to form higher-molecular-weight complexes indicative of aggregation. (A) Blue native polyacrylamide gel electrophoresis (BN-PAGE) analysis of ADAT3-GFP. Extracts prepared from HEK 293T cells expressing either ADAT3-WT or -V144M were separated on 3 to 12% BN-PAGE gels, followed by immunoblotting and probing with the indicated antibodies. The arrow and arrowhead point to predominant bands found in the WT and V144M extracts, while the bracket encompasses the high-molecular-weight signal detected in the ADAT3-V144M lane. Total protein indicates staining of the same blot to show loading of extracts. (B) Increased self-association of ADAT3-V144M. Shown are immunoblots for the indicated proteins from the input (5%) or biotin elutions from Strep-Tactin affinity purifications (20%) from HEK 293T cells transfected to express ADAT3-Strep-WT with GFP-ADAT3-WT or ADAT3-Strep-V144M with GFP-ADAT3-V144M in the absence or presence of ADAT2 coexpression. * represents the ADAT3-Strep signal from previous probing. The percentage of ADAT3 copurified represents the ratio of the GFP-ADAT3 signal present in the eluted fraction normalized to the Strep-ADAT3 signal relative to ADAT3-WT. Experiments for panels A and B were repeated three times.
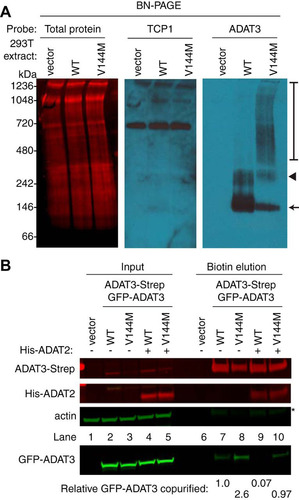
FIG 8 ADAT3-V144M is bound by the HSP60 and TRiC chaperonins. (A) Silver staining of eluted FLAG affinity purifications from HEK 293T cells expressing the FLAG tag alone (vector), FLAG-ADAT3-WT, or FLAG-ADAT3-V144M. The arrowhead represents FLAG-ADAT3, and the arrow represents a protein that specifically copurifies with ADAT3-V144M. (B) Chaperonin proteins identified by LC-MS proteomics specifically in ADAT3-V144M purifications. ADAT3 peptides are included for comparison. The number of unique peptides and Mascot score associated with each protein are noted. (C to E) Immunoblots for the indicated proteins from the input (5%) or FLAG affinity purifications (100%) from HEK 293T cells transfected to express FLAG-ADAT3-WT or -V144M without or with His-ADAT2. Purified samples represent SDS heat elutions of purified proteins retained on anti-FLAG antibody resin. IP immunoblots were repeated three times, with comparable results. * in panels A and C represents heavy and light chains of the anti-FLAG antibody used for affinity purification.
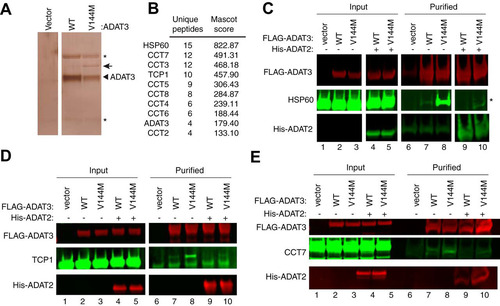
FIG 9 ADAT3-V144M displays an aberrant nucleocytoplasmic localization and increased susceptibility to form cytoplasmic aggregates. (A) Fluorescence microscopy images of GFP alone and GFP-tagged ADAT3-WT and -V144M expressed in HeLa cervical carcinoma cells. The bottom two rows exhibit cells cotransfected with untagged ADAT2. Nuclear DNA was stained with Hoechst stain, with merged images shown on the right. Arrowheads represent cells with >3 cytoplasmic foci of GFP-ADAT3. (B) Fraction of cells exhibiting GFP-ADAT3 that was either primarily cytoplasmic (cyto), similarly distributed between the cytoplasm and nucleus (cyto/nuclear), or primarily nuclear. (C) Fold change in the number of cells that exhibited more than three cytoplasmic foci of GFP-ADAT3. The fold change is expressed relative to ADAT3-WT without ADAT2 coexpression where 7% of cells exhibited more than three cytoplasmic foci. Experiments for panels B and C were repeated three times, with a minimum of 580 cells counted per experiment. (D) Immunoblot of GFP-ADAT3 expression without or with transient expression of ADAT2.
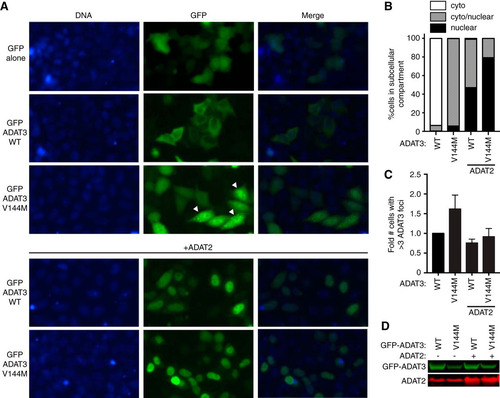
FIG 10 ADAT3-V144M displays an aberrant nucleocytoplasmic localization and increased susceptibility to form cytoplasmic aggregates also when tagged at the C terminus with GFP (ADAT3-GFP). (A) Fluorescence microscopy images of GFP alone and GFP-tagged ADAT3-WT and -V144M expressed in HeLa cervical carcinoma cells. Nuclear DNA was stained with Hoechst stain, with merged images shown on the right. (B) Fraction of cells exhibiting ADAT3-GFP that was either primarily cytoplasmic, similarly distributed between the cytoplasm and nucleus, or primarily nuclear. (C) Fold change in the number of cells that exhibited more than three cytoplasmic foci of GFP-ADAT3. For panels B and C, a minimum of 615 cells were counted per experiment. (D) Immunoblot of ADAT3-GFP expression without or with ADAT2 coexpression.
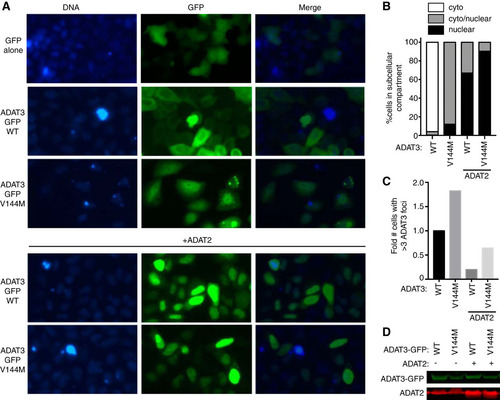
FIG 11 Predicted structure of ADAT3 and potential effects of the V144M mutation. (A) Schematic of ADAT3 with the location of the V144M mutation. (B) Based upon template-based tertiary structure prediction, ADAT3 is predicted to fold into two domains consisting of the amino-terminal extension and the deaminase domain. Valine 144 is highlighted in green in ball-and-stick form. The structure of the homodimeric E. coli TadA (PDB code 1Z3A) is aligned with the predicted C-terminal domain of ADAT3. Each monomer of TadA is shown in light blue and gray, respectively. (C) Amino-terminal extension of ADAT3, with the side chain of valine 144 shown in green in space-filling form. The side chain of threonine 151 is also shown in space-filling form in the same color as in the ribbon sequence. (D) Amino-terminal extension of ADAT3, with the V144M mutation shown in green. Atoms in the side chain of threonine 151 that clash with the methionine 144 side chain are shown in red.
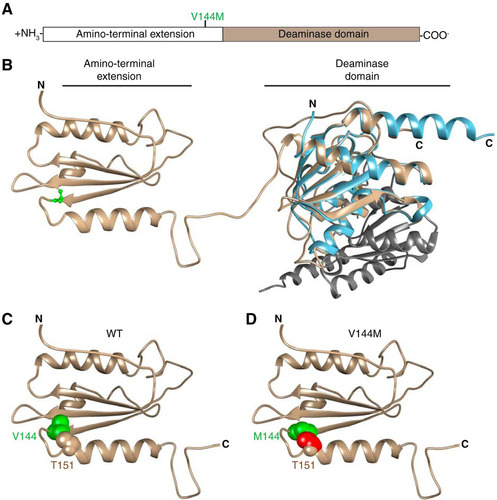
TABLE 1 Mass spectrometry parameters of all analyzed nucleosides