Figures & data
FIG 1 RACK1 is essential for efficient translation of capped mRNAs in vitro. (A) Scheme representing the in vitro translation strategy used. (B) Diagrams of the mRNA reporters employed. (C) Absolute luciferase counts from in vitro translation of the reporters. Values are shown on a logarithmic scale. A.U., arbitrary units. (D) Representative Western blot assessing RACK1 protein depletion in samples used for in vitro translation. scr, scrambled sequence. (E) Quantification of RACK1 protein in the samples. RACK1 protein levels were normalized to β-actin levels. (F) Quantification of the translational efficiency, in vitro, of cap-, TOP-, and short loop-regulated mRNA reporters under conditions of RACK1 downregulation. (G) Quantification of the in vitro translational outputs of long loop-, uORF-, and HCV IRES-regulated reporters upon RACK1 downregulation. Data are from a representative assay. At least four independent replicates were performed for each assay. Means and standard deviations are shown. Statistical significance was determined by the t test. P values are indicated as follows: *, <0.05; **, <0.01.
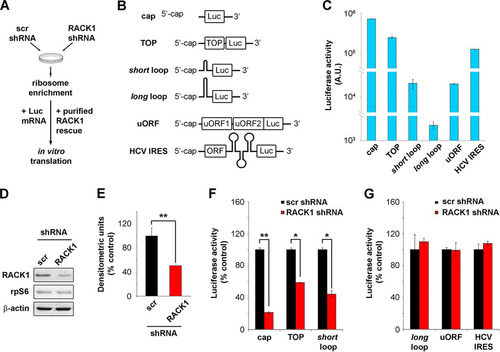
FIG 2 RACK1 binding to the ribosome is necessary for modulating translation. (A) Representative Coomassie blue-stained gel showing purified MBP-RACK1 proteins prior to MBP cleavage. wt, wild type; mut, mutant. (B) Efficiencies of binding of recombinant proteins (MBP [used as a control], wild-type RACK1, and R36D K38E mutant RACK1) to the ribosome as measured by an in vitro ribosome interaction assay. (C) Quantification of in vitro translational efficiencies of different mRNAs under conditions of RACK1 depletion that were rescued by recombinant wild-type or mutant RACK1 proteins. Data are from representative assays. At least four independent replicates per experiment were performed. Means and standard deviations are shown. Statistical significance was determined by the t test. P values are indicated as follows: *, <0.05; **, <0.01; ***, <0.001.
![FIG 2 RACK1 binding to the ribosome is necessary for modulating translation. (A) Representative Coomassie blue-stained gel showing purified MBP-RACK1 proteins prior to MBP cleavage. wt, wild type; mut, mutant. (B) Efficiencies of binding of recombinant proteins (MBP [used as a control], wild-type RACK1, and R36D K38E mutant RACK1) to the ribosome as measured by an in vitro ribosome interaction assay. (C) Quantification of in vitro translational efficiencies of different mRNAs under conditions of RACK1 depletion that were rescued by recombinant wild-type or mutant RACK1 proteins. Data are from representative assays. At least four independent replicates per experiment were performed. Means and standard deviations are shown. Statistical significance was determined by the t test. P values are indicated as follows: *, <0.05; **, <0.01; ***, <0.001.](/cms/asset/54d6d034-c20b-4611-8112-44e721692e47/tmcb_a_12276874_f0002.jpg)
FIG 3 RACK1 on the ribosome recruits eIF4E. (A) Diagrams of mRNAs, with or without an in vitro-synthesized poly(A) tail, employed in the experiment for which results are shown in panel B. (B) In vitro translational efficiencies (expressed as percentages of the control value, taken as 100%) of RACK1-depleted mRNAs either with or without an in vitro-synthesized poly(A) tail. (C) Schematic representation of the purification strategy and analysis approach for mRNA-associated ribosomes and translation factors. (D) Western blots of translation factors and ribosomal proteins copurified with translating mRNAs in vitro under conditions of RACK1 depletion. (E) Quantification (from three independent replicates) of the levels of eIF4E copurifying with a cap-presenting pRL-TK mRNA as shown by Western blotting in panel D. (F) Western blotting for proteins from HeLa cell extracts copurifying with His-eIF4E in vitro under conditions of mRNA digestion (− mRNA) or mRNA reconstitution (+ mRNA). (G) Western blotting to assess the ability of eIF4E to interact with purified RACK1 in vitro. Representative Western blots are shown. In graphs, means and standard deviations are shown. Statistical significance was determined by the t test. P values are indicated as follows: *, <0.05; **, <0.01. At least four independent replicates per experiment were performed.
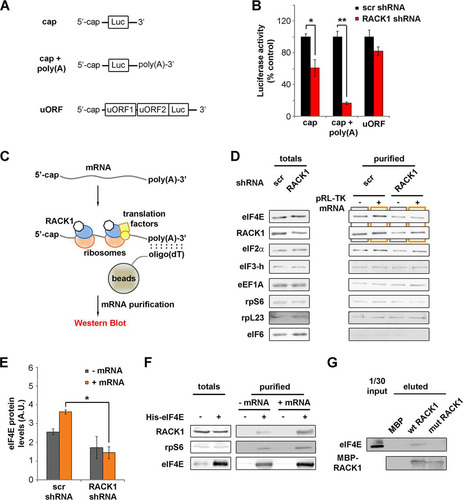
FIG 4 R36D K38E mutant RACK1 does not bind ribosomes efficiently. (A) Ribosome profiles coupled with Western blots show the distribution of RACK1-HaloTag in the profile fractions. rpS6 and eIF6 were used as markers of the 40S and 60S ribosomal subunits. Note the absence of mutant RACK1 from polysomes. (B) Western blotting was performed to assess the abilities of HaloTag-labeled wild-type and mutant RACK1 to copurify with 40S ribosomal proteins under conditions of mRNA degradation. (C) The ability of PKCβII to copurify with wild-type and mutant RACK1-HaloTag, independently of RACK1 binding to ribosomes, is shown by Western blotting on eluted samples. PMA, phorbol myristate acetate.
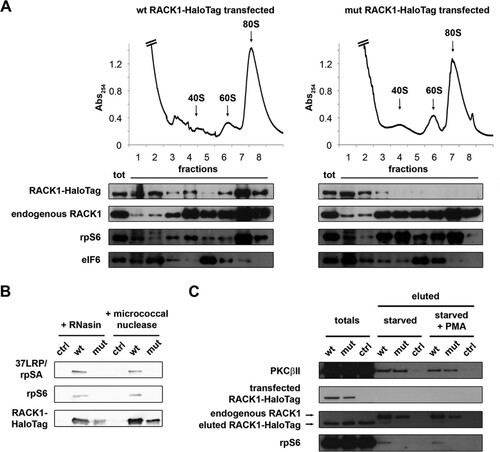
FIG 5 Unstable extraribosomal RACK1 inhibits cell cycle progression. (A) Western blotting to monitor the levels of wild-type and R36D K38E mutant RACK1 proteins in stably transfected cells after FACS purification of construct-positive populations. (B) Fluorescent marking of wild-type and mutant RACK1 constructs is shown at different time points in order to evaluate the half-lives of the proteins. Bar, 5 μm. (C) Representative FACS analysis of cells expressing wild-type or mutant RACK1 in the presence of BrdU incorporation. (D) Histogram showing the repartition of cell populations from panel C throughout the phases of the cell cycle. Data are means and standard deviations of results from three independent experiments. Statistical significance was determined by the t test. P values are indicated as follows: *, <0.05; ***, <0.001.
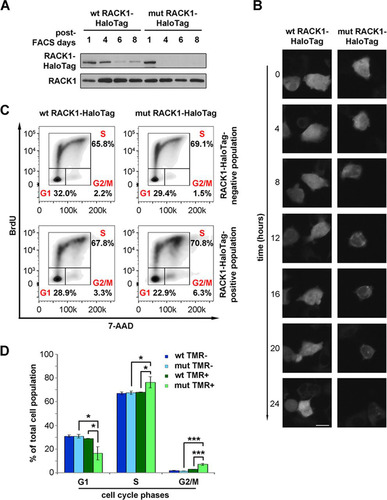
FIG 6 Free RACK1 represses translation in living cells. (A) Schematic representation of the puromycin incorporation assay used to quantify translation output at the single-cell level. (B) Quantitative Western blotting to detect the amounts of newly incorporated puromycin in lysates of RACK1-expressing cells. (C) Representative FACS analyses for puromycin incorporation correlate the translational rate and the expression of wild-type or mutant RACK1. (D) Comparison of the amounts of the TMR-positive, puromycin-positive populations from the experiment described in the text. Data are means and standard deviations of results from three independent experiments. Statistical significance (***, P < 0.001) was determined by the t test.
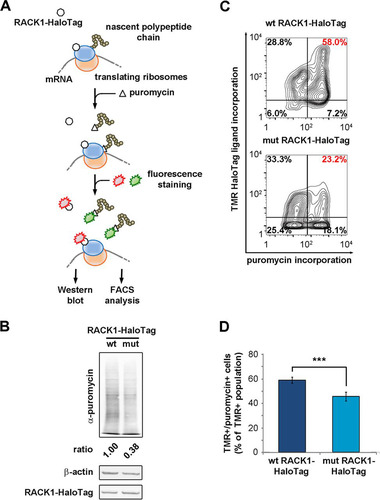
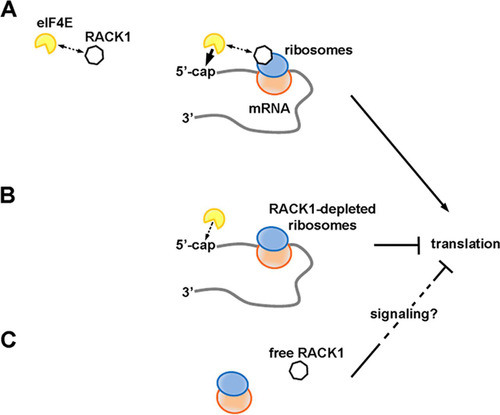
FIG 7 RACK1 has different effects on translation depending on its binding to the ribosome. (A) RACK1 can recruit eIF4E, possibly facilitating a well-timed association of eIF4E with the 5′ caps of mRNAs on translating ribosomes. This would increase translational levels. (B) RACK1-deprived ribosomes are less efficient at recruiting eIF4E, and their translational output is diminished. (C) Free RACK1, if released or not associated with the ribosome, can repress translation, possibly via signaling.