Figures & data
FIG 1 Results of an assay for measuring serine protease activity in human cardiomyocytes. (a) CORIN gene expression in induced pluripotent stem cell-derived cardiomyocytes (iPS-CM) and human cardiac tissue specimens of atrial and ventricular origin analyzed by qRT-PCR. Results are expressed relative to the expression of GAPDH (encoding glyceraldehyde-3-phosphate dehydrogenase) (n = 3 to 6). (b) Membrane expression of corin in iPS-CM analyzed by immunostaining and flow cytometry. Shown are representative histograms for negative-control cells stained only with secondary antibody and cells stained with a corin antibody. (c) Structure of the fluorogenic serine protease substrate used in the assay. The red arrows indicate the two serine protease cleavage sites of the substrate. (d) Reaction progress curves for a range of substrate concentrations. The increases in fluorescence were linear and proportional to substrate concentrations. Data are derived from three separate experiments. RLU, relative light units. (e) CORIN gene expression in iPS-CM transfected with siRNA for CORIN (siCORIN) or scrambled negative-control siRNA (siScr). Results are expressed relative to the results for GAPDH and are based on three separate experiments. ***, P < 0.001, using Student’s t test. (f) Michaelis-Menten saturation curves for cells transfected with scrambled control siRNA or CORIN siRNA and cells treated with 2 mM benzamidine. Data are derived from three separate experiments.
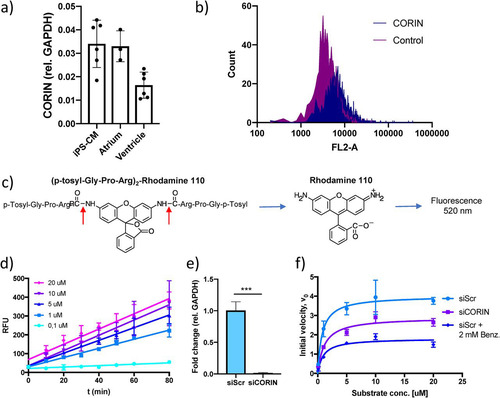
FIG 2 Identification of miR-1 as a regulator of cardiac serine protease activity and ANP biogenesis. (a) Overview of the screening procedure. (b) Initial reaction velocity (V0) for each miRNA family inhibitor ranked according to effect. Data for miRNA inhibitors that caused a statistically significant difference in V0 (P < 0.05 using Student’s t test) are shown in blue, and data for the only inhibitor whose results remained significant after adjusting for multiple comparisons (q < 0.05, using the false discovery rate approach), miR-1, are shown in green. Data for cells transfected with a negative-control (NC) miRNA family inhibitor are shown in red. Results are based on two separate screenings with two technical replicates each. (c) RNA sequences for the two miRNA-1 family members, miR-1-3p and miR-206, with the seed sequence shown in red. (d) Expression of miR-1-3p and miR-206 relative to that of U6 RNA in iPS-CM and human cardiac tissue specimens of atrial and ventricular origin, measured by qRT-PCR (n = 3 to 6). (e) Expression of miR-1 in iPS-CM transfected with LNA antisense inhibitor anti-miR-1 analyzed by qRT-PCR. Data are expressed relative to the results for U6 RNA and normalized to the mean value of the control cells (anti-miR-Ctrl). *, P < 0.05, using Student’s t test. Data are derived from three separate experiments. (f) Michaelis-Menten saturation curves for iPS-CM transfected with anti-miR-1 or scrambled control anti-miRNA. Results are based on three separate experiments. (g) Concentrations of ANP in the supernatants of iPS-CM transfected with anti-miR-1 or scrambled control anti-miRNA measured by enzyme-linked immunosorbent assay (ELISA). ***, P < 0.001, using Student’s t test. Data are derived from three separate experiments.
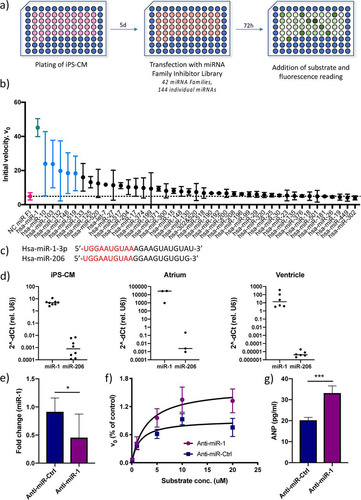
FIG 3 Analysis of the miR-1-3p targetome. (a) miR-1 expression in iPS-CM transfected with pre-miR-Ctrl or pre-miR-1. Results are expressed relative to the expression of U6 RNA and normalized to the mean value for the control cells. *, P < 0.05, using Student’s t test. Data are derived from three separate experiments. (b) Scatter plot showing genes enriched or depleted >2-fold in AGO2-immunoprecipitated RNA from cells transfected with pre-miR-1 compared to the results for cells transfected with pre-miR-Ctrl. The expression value for each gene is normalized to that of its input control. (c) Enrichment of CDC42 and CORIN in AGO2-immunoprecipitated RNA from iPS-CM transfected with pre-miR-1 compared to their expression levels in cells transfected with pre-miR-Ctrl was validated with qRT-PCR. Shown are relative expression levels for the negative-control samples (IgG) and the AGO2 samples, normalized to the value for input RNA. Results are derived from three separate experiments. **, P < 0.01, comparing the levels of AGO2-associated RNA between cells transfected with pre-miR-Ctrl and pre-miR-1 using 2-way analysis of variance (ANOVA) with Sidak’s multiple-comparison test.
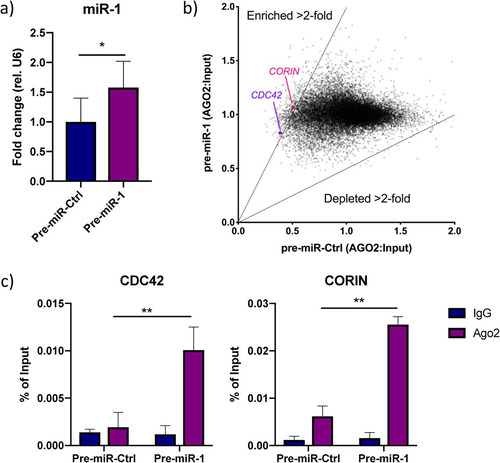
FIG 4 miR-1 negatively regulates corin expression through binding to a site in the 3′ UTR. (a) Representation of the predicted miR-1-3p target site (red letters) in the 3′ UTR of corin mRNA. (b) Relative expression of CORIN in iPS-CM transfected with pre-miR-1 or anti-miR-1 measured by qRT-PCR. Results are derived from three separate experiments. Data are normalized to the expression of GAPDH and expressed relative to the mean value for the respective control group. **, P < 0.01, using Student’s t test. (c) Membrane expression of corin in iPS-CM transfected with pre- or anti-miR-1 analyzed with flow cytometry. Cells were stained with a corin antibody, and the mean fluorescence intensity (MFI) in the FL-2 channel was measured. Data are derived from three separate experiments. *, P < 0.05 using Student’s t test. (d) A reporter plasmid with the 3′ UTR of corin cloned downstream from the Gaussia luciferase gene (pCOR) was cotransfected with pre- or anti-miR-1 (or corresponding controls) in iPS-CM, and the luminescence signal was measured after 72 h. The signal from the passive reporter gene, encoding SEAP, was used for normalization of the luciferase signal. The results are derived from three separate experiments. **, P < 0.01, using Student’s t test. The reporter assay was repeated with a plasmid in which the predicted miR-1 target site had been deleted by site-directed mutagenesis (pCORΔm1) or with an empty reporter vector (pNull).
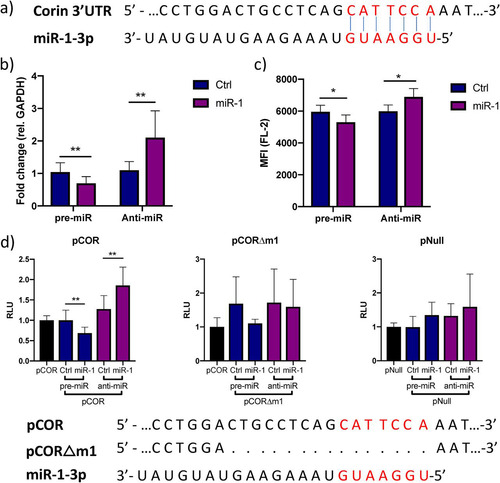
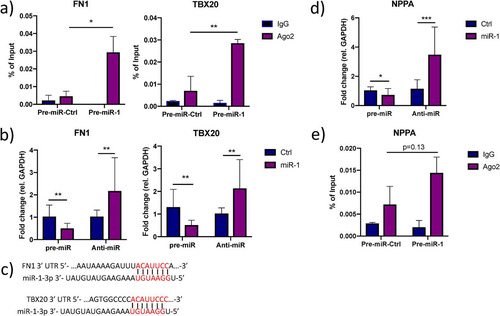
FIG 5 Additional effects of miR-1 on ANP biogenesis. (a) Enrichment of FN1 and TBX20 in AGO2-immunoprecipitated RNA from iPS-CM transfected with pre-miR-1 compared to their expression levels in cells transfected with pre-miR-Ctrl was validated with qRT-PCR. Shown are relative expression levels for the negative-control samples (IgG) and the AGO2 samples, normalized to the value for input RNA. Results are derived from three separate experiments. *, P < 0.05, and **, P < 0.01, comparing the levels of AGO2-associated RNA between cells transfected with pre-miR-Ctrl and pre-miR-1 using 2-way ANOVA with Sidak’s multiple-comparison test. (b) Relative expression of FN1 and TBX20 in iPS-CM transfected with pre- or anti-miR-1 measured by qRT-PCR. Results are derived from three separate experiments. Data are normalized to the expression of GAPDH and expressed relative to the mean value for the respective control group. **, P < 0.01, using Student’s t test. (c) Representation of the predicted miR-1-3p target sites in the 3′ UTR of ATF2, FN1, and TBX20 mRNA. (d) Relative expression of NPPA in iPS-CM transfected with pre- or anti-miR-1 measured with qRT-PCR. Expression data were normalized to the expression of GAPDH and expressed relative to the mean value for the controls. *, P < 0.05, and ***, P < 0.001, using Student’s t test. Results are derived from three separate experiments. (e) Level of NPPA in AGO2-immunoprecipitated RNA from iPS-CM transfected with pre-miR-1 compared to the level in cells transfected with pre-miR-Ctrl measured with qRT-PCR. Shown are relative expression levels for the negative-control samples (IgG) and the AGO2 samples, normalized to the value for input RNA. Results are derived from three separate experiments. Statistical significance was determined by t test using 2-way ANOVA with Sidak’s multiple-comparison test.