Figures & data
FIG 1 Schematic representation of the RAG locus and the BCL11A superfamily. (A) Transcriptional regulators and binding regions. The human RAG locus is shown, with positions of previously described enhancers (blue arrows), promoters (blue boxes), and exons (black boxes) given; the transcriptional polarities of Rag1 and Rag2 are indicated with black arrows. Positions of DNA binding sites for TFs determined previously (Citation9, Citation10, Citation13, Citation14, Citation16, Citation19, Citation20) or here (BCL11A-XL) to bind within these regions are indicated by vertical lines. (B) BCL11A superfamily of TFs involved in hematological malignancy. Each member has a highly conserved N terminus, MSRRK, shown in this study to be essential for BCL11A-XL transcriptional activity. This is followed by a single, canonical C2HC zinc finger, which is followed by one or more single, double, or triple zinc fingers of the C2H2 type. The BCL11A and BCL11B genes, as well as the early hematopoietic zinc finger (EHZF) gene and the friend-of-GATA hematopoietic transcription regulator FOG1 and FOG2 genes, all encode zinc finger proteins with these conserved features, and several have been implicated in malignancy (Citation23, Citation25, Citation37, Citation41, Citation55).
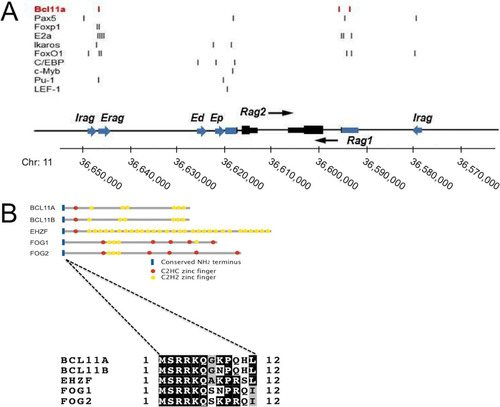
FIG 2 BCL11A-XL regulates RAG expression. (A) Microarray identification of RAG1 upregulation. The indicated human B cell lines were stably transduced with a BCL11A-XL (XL) retrovirus or with pXY-puro empty vector. Expression profiling was performed in multiple (n > 4) independent experiments tracked by multiple probe elements spotted per microarray. Data shown are for several transcripts upregulated at least 2-fold relative to those in the vector control in all B cell lines. (B) Overexpression of BCL11A-XL upregulates RAG. Human NALM6 pre-B cells were stably transduced with BCL11A-XL (XL) or the pXY-puro virus control (V). (Left) Western blot. Flag BCL11A, anti-Flag detection of viral BCL11A-XL expression; total BCL11A, anti-BCL11A-XL MAb detection; β-tubulin, anti-β-tubulin control. (Right) RT-PCR demonstrating upregulation of RAG1 and RAG2. Serial template dilution (3-fold; indicated by triangles) confirmed that RT-PCR was semiquantitative. GAPDH was used as a loading control. (C) Inducible shRNA knockdown of BCL11A-XL reduces RAG expression. BJAB B cells were first stably transduced with a retrovirus expressing the bacterial tetracycline repressor (TETR) and the blasticidin resistance gene and then with a pRSMX-PG retrovirus containing shRNA targeted to exon 2 of the BCL11A-XL gene under the control of a modified H1 promoter containing binding sites for TETR (Citation68). Significant downregulation of BCL11A-XL protein (left) and transcript (right) with concomitant downregulation of RAG1 and RAG2 was observed 24 h following addition of the tetracycline analog doxycycline (Dox).
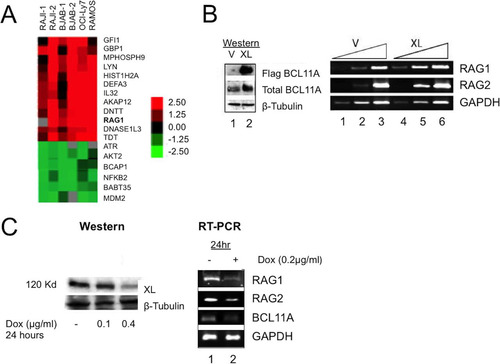
FIG 3 BCL11A is recruited to the RAG1 promoter and the Erag enhancer in vivo and in vitro. (A) ChIP-PCR identified the RAG1 promoter and Erag enhancer as targets for BCL11A binding. A rabbit polyclonal antibody (BL1797; Bethyl) specific to the BCL11A-XL C terminus (XL Ab) was used to immunoprecipitate NALM6 pre-B cell chromatin. The samples were reverse cross-linked, purified, and analyzed by semiquantitative PCR, using primers that amplify regions within the proximal RAG1 and RAG2 promoters and within the Erag enhancer. Specific enrichment was observed for the RAG1 promoter and the Erag enhancer but not for the RAG2 promoter (lanes 3). PCRs with 1% input were used as positive controls (lanes 1). Purified rabbit IgG antibodies (con Ab) did not immunoprecipitate target DNA significantly (lanes 2). (B) BCL11A binds to the Erag enhancer in vitro. A 196-bp probe extending from the 5′ boundary (KpnI site) to the end of region A of Erag (Citation13) was labeled with 32P and then incubated with nuclear extracts prepared from the RAJI B cell line. Specificity of binding was tested by further incubation of the indicated probe-nuclear extract mixtures with anti-BCL11A-XL C-terminal (BL1797) polyclonal (C-Term Ab) and monoclonal (MAb Ab123) antibodies, monoclonal anti-PU.1 (α-PU.1 Ab), or control polyclonal (α-IgG Ab) and monoclonal (α-Tubulin Ab) antibodies employed at the same concentrations. Cold competitions employed double-stranded 30-mers of wild-type (cold oligo) and mutated (cold mutant oligo) sequences spanning the putative BCL11A binding site at nt 121 to 131. Triangles represent molar excesses of 10, 50, and 100 relative to the amount of labeled probe. Complexes were resolved in 6% native gels, with specific binding highlighted by a box. (C and D) BCL11A binds to a consensus site within the distal region (positions −426 to −416) of the RAG1 promoter. The probe was a 300-bp KpnI-XhoI fragment. (E) BCL11A binds to a consensus site within the proximal region (positions −207 to −197) of the RAG1 promoter. The probe was a 263-bp PCR product spanning positions −228 to +35. (F) Alignment of BCL11A binding sites determined in this study with the consensus for the top 500 peaks determined by ENCODE ChIP-seq for a human B cell lymphoma (GM12878) (Citation38).
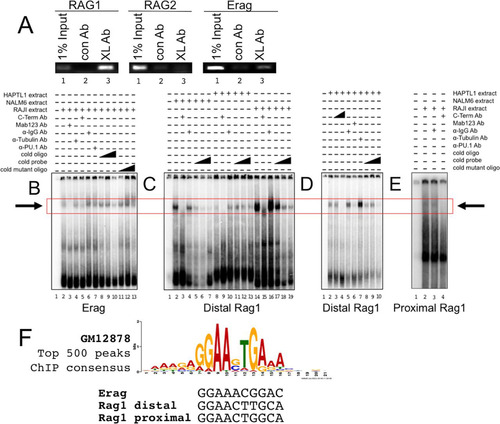
FIG 4 RAG transcriptional reporter activity is activated in pre-B cells but repressed in non-B cells following BCL11A-XL overexpression. (A) Establishment of stable overexpression. A70 pre-B cells were transduced with pXY-IRES-puro (V) or pXY-BCL11A-XL (XL) and selected with 1 μg/ml of puromycin for 6 days. Triangles represent 5-fold dilutions of cDNA. (B) BCL11A-XL transactivates RAG1 promoter- and Erag-RAG2 promoter-driven transcription in A70 pre-B cells but represses RAG promoter-driven activity in 293T epithelial cells. A70 and 293T cells stably transduced with pXY vector only, BCL11A-XL (XL), or BCL11A-XL mutated at an essential N-terminal K5 residue (XL-K5/A) were transiently transfected with the indicated firefly luciferase constructs and the Renilla luciferase control as described in Materials and Methods. Cells were harvested 40 to 48 h later, and firefly luciferase values were normalized to Renilla luciferase values. The ratios were expressed as fold changes by arbitrary assignment of a value of 1.0 to the empty vector (pXY-IRES-puro for pre-B cells and pCMV10 for non-B cells). Fold changes are plotted on the y axis, with the magnitude of activation denoted by increasing positive values and repression by negative values. Error bars indicate standard deviations for 3 to 5 independent experiments. (C) Wild-type BCL11A-XL and the BCL11A-K5/A mutant localize indistinguishably within the nuclear matrix of paraspeckles in pre-B and non-B cells. (Top) Fixed mounts of GFP-BCL11A-XL and GFP-BCL11A-XL-K5/A were imaged following transient transfection into 293T cells. Ectopically transduced A70-BCL11A-XL cells were stained with anti-BCL11A MAb Ab123. (Bottom) Biochemical fractionation of transiently transfected 293T cells with the indicated BCL11A-XL wild-type or mutant construct. Equivalent amounts of cytoplasmic (C), soluble nuclear (NP), chromatin (C), and nuclear matrix (NM) fractions were subjected to SDS-PAGE (Citation26) and then Western blotted with antibodies specific for BCL11A or for the NM marker lamin B.
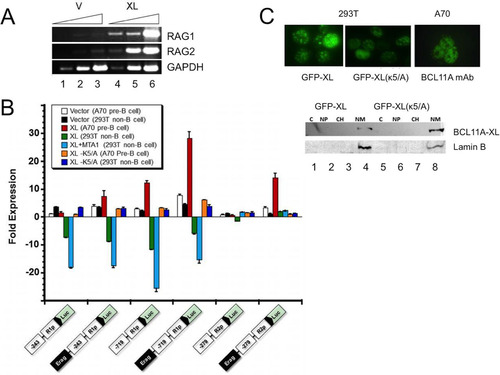
FIG 5 Enforced expression of BCL11A-XL in A70-INV pre-B cells induces V(D)J recombination. (A and B) Establishment of stable overexpression in A70-INV pre-B cells. Transductions and drug selection were performed as described in the legend to . (A) Anti-Flag Western blot detection of ectopic BCL11A-XL and anti-BCL11A immunoblot detection of total expression of BCL11A-XL. β-Tubulin served as a loading control. (B) Transduction of A70-INV cells with BCL11A-XL upregulated RAG1 and RAG2 mRNAs relative to those in mock-transduced cells. GAPDH was the loading control. (C) Schematic diagram of recombination signal sequence (RSS; black and white triangles)-mediated inversion within the integrated retroviral RAG substrate in A70-INV pre-B cells. Primers used to amplify the inversion are denoted by arrows. (D) Flow cytometry detection of enhanced V(D)J recombination substrate inversion in A70-INV pre-B cells overexpressing BCL11A-XL (XL) or treated with the Abelson kinase inhibitor STI571. Cells were transduced as described in previous legends and then incubated in the absence (STI −) or presence (STI +) of 3 μM STI571 for 72 h. Inversion of pMX-INV resulted in GFP expression, which was quantified by fluorescence-activated cell sorter (FACS) analysis following exclusion of dead cells by forward and side scatter characteristics. x axis, GFP fluorescence intensity; y axis, cell numbers. The percentage of GFP-positive cells is noted in each plot. (E) PCR validation of RSS-mediated inversion of pMX-INV substrates. Genomic DNA was isolated from the indicated cell lines for PCR following the strategy and primers shown in panel C. STI571 (STI) treatment (3 μM, 48 h) or transduction with BCL11A-XL retrovirus induced inversion of GFP, allowing PCR amplification (lanes 2 and 4). PCR amplification of the endogenous Rag1 gene (which is unaffected by RSS-mediated recombination) provided a DNA loading control.
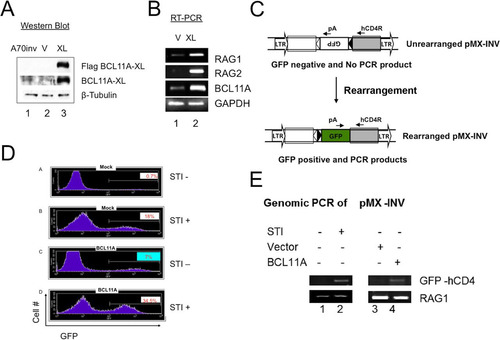
FIG 6 Modulation of BCL11A expression modulates V(D)J rearrangement. (A) BCL11A-XL overexpression induces Vκ-Jκ recombination in A70-INV pre-B cells. A degenerate Vκ consensus primer (Vcon) and a Jκ2-1 reverse primer (top panel) were used to amplify rearrangements from genomic DNA diluted in 3-fold increments (triangles) to ensure nonsaturating semiquantitative PCR. The strategy predicts products of 190 bp (VJκ2) and 540 bp (VJκ1). Amplified DNAs were resolved in agarose gels, transferred to nylon membranes, and then visualized by autoradiography following hybridization to the Jκ2-2 probe (top panel). (B) Flow cytometric analysis of Bcl11aL/L bone marrow cells following primary infection with the MSCV-Bcl-xL retrovirus and secondary superinfection with a Thy-1.1-expressing MIT or MIT-Cre retrovirus. Cells were stained with antibodies directly conjugated to phycoerythrin (PE-B220) and fluorescein isothiocyanate (FITC–Thy-1.1). (C) Flow cytometric analysis of DNA content/cell cycle progression of Bcl11aL/L bone marrow cells following the retroviral infection protocol detailed for panel B. Detergent-permeabilized cells were stained with propidium iodide and analyzed as described in Materials and Methods, using CellQuest software to calculate percentages of cells in the G1 (M1), G2/M (M2), and S (M1-M2 interval) phases. (D) Cre recombinase-mediated deletion of loxP (L)-modified Bcl11a alleles (Bcl11aL/L ) blocks Vκ-Jκ recombination in pre-B/IL-7 bone marrow (BM) cultures. Following retroviral infection as detailed for panel B, semiquantitative and real-time PCRs of genomic DNAs were performed on samples serially diluted 5-fold (triangles). DNAs amplified semiquantitatively were gel fractionated and either directly visualized by ethidium bromide staining (top and bottom panels) or visualized following hybridization as described for panel A (middle panel). PCRs of Cμ served as loading controls. Real-time PCR values, shown as fold reductions (Fold ↓) below corresponding lanes, were determined for each DNA dilution by dividing each MIT control value by the corresponding MIT-Cre value. The analyses are representative of 4 independent experiments performed with 4 separate BM isolates.
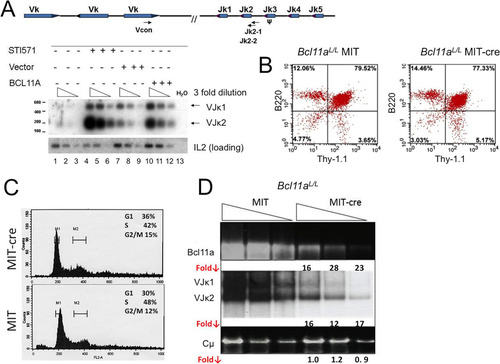
FIG 7 Comparison of BCL11A-XL overexpression levels following induction of V(D)J recombination-associated genes and following isolation of RNA from lymphoid cell types. Pro-B (220-8) (left) and pre-B (A70) (right) cell lines were either treated with STI571 (3 μM for 20 h) or stably transduced with BCL11A-XL (XL) or empty virus (M) as described in the legend to and then subjected to semiquantitative RT-PCR analysis. cDNAs were amplified under linear conditions, gel fractionated, and visualized by ethidium bromide staining. GAPDH was the loading control.
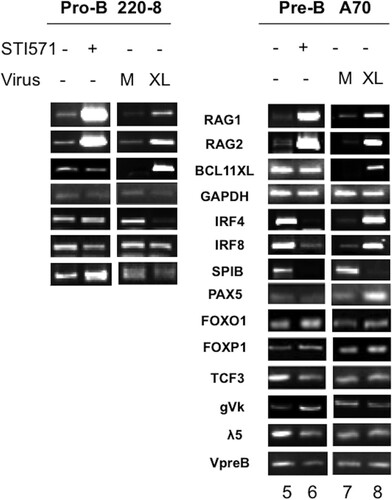
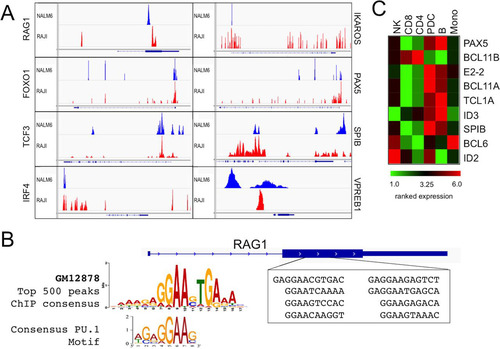
FIG 8 ChIP-seq analysis of genome-wide BCL11A target binding in human lymphoid cell lines. (A) ChIP-seq analysis of BCL11A was performed in the human pre-B cell line NALM6 and the human Burkitt's lymphoma line RAJI (all peak scores were ≥10). A target gene was defined by a binding site occurring within 50 kb upstream of and within the body of the gene. Analysis of the false-discovery rate and associated q values was performed using Benjamini-Hochberg statistics. BCL11A directly bound RAG1 and genes for TFs known to control RAG1/2 expression, including IKZF1/IKAROS, FOXO1, PAX5, TCF3, SPIB, and IRF4. BCL11A also directly bound the surrogate light chain VPREB1 promoter region. (B) Alignment of BCL11A-bound RAG1 target sites by ChIP-seq. Over an ∼1-kb stretch, we identified 8 repeats of 10 to 12 bp that shared strong similarity with one another as well as with the BCL11A-XL binding site consensus deduced from the EMSA data shown in . The Rag1 internal site, as with the promoter site, contained a perfect consensus PU.1 motif. (C) Microarray analysis of human peripheral blood showing high expression of BCL11A transcripts in B cells (B) and plasmacytoid dendritic cells (pDCs) but not in monocytes (mono), NK cells, or T cells (CD4 or CD8). The microarray profile corresponds directly to what has been observed by analyzing BCL11A protein expression using the anti-BCL11A Ab123 monoclonal antibody (Citation31, Citation33). Two BCL11A target genes expressed highly in pDCs (Spi-B and IRF-8) have been shown to regulate the development of pDCs (Citation31, Citation33).