Figures & data
FIG 1 Hcfc1hepKO/Y males display rapid loss of wild-type Hcfc1 expression in hepatocytes and subsequent liver pathology. (A) View of the reads mapped on the 26 exons of the Hcfc1 gene, shown in blue at the top, in control (day 0 [0d]) liver and Alb-Cre-ERT2tg; Hcfc1hepKO/Y livers 1, 2, and 4 days (1d, 2d, and 4d, respectively) after tamoxifen treatment according to RNA-Seq analysis. Arrows point to the reads observed at Hcfc1 exons 2 and 3. The total relative Hcfc1 transcript expression level is listed to the right. (B) Immunofluorescence analysis of paraffin-embedded sections from control (0d) liver and Alb-Cre-ERT2tg; Hcfc1hepKO/Y livers 2, 4, and 7 days after tamoxifen treatment and stained with 4’,6-diamidino-2-phenylindole (DAPI) (blue) together with antibodies against HCF-1 (green) and HNF4α (red). Arrows point to hepatocytes. Scale bars, 50 μm. (C) Image of HCF-1 ChIP-Seq reads mapped onto the Hcfc1 gene from control (0d) and Alb-Cre-ERT2tg; Hcfc1hepKO/Y livers 4 days after tamoxifen treatment (4d). TSS, transcription start site. (D) AST levels in control Hcfc1lox/Y (blue; n = 3/time point), Alb-Cre-ERT2tg; Hcfc1hepKO/+ (green; n = 3/time point), and Alb-Cre-ERT2tg; Hcfc1hepKO/Y (red; n = 3/time point) livers at 0, 4, 8, 14, and 17 days after tamoxifen treatment. (E) Macroscopic comparison of control liver (0d) and tamoxifen-treated knockout Alb-Cre-ERT2tg; Hcfc1hepKO/Y livers after 7, 14, and 18 days. Scale bar, 1 cm.
![FIG 1 Hcfc1hepKO/Y males display rapid loss of wild-type Hcfc1 expression in hepatocytes and subsequent liver pathology. (A) View of the reads mapped on the 26 exons of the Hcfc1 gene, shown in blue at the top, in control (day 0 [0d]) liver and Alb-Cre-ERT2tg; Hcfc1hepKO/Y livers 1, 2, and 4 days (1d, 2d, and 4d, respectively) after tamoxifen treatment according to RNA-Seq analysis. Arrows point to the reads observed at Hcfc1 exons 2 and 3. The total relative Hcfc1 transcript expression level is listed to the right. (B) Immunofluorescence analysis of paraffin-embedded sections from control (0d) liver and Alb-Cre-ERT2tg; Hcfc1hepKO/Y livers 2, 4, and 7 days after tamoxifen treatment and stained with 4’,6-diamidino-2-phenylindole (DAPI) (blue) together with antibodies against HCF-1 (green) and HNF4α (red). Arrows point to hepatocytes. Scale bars, 50 μm. (C) Image of HCF-1 ChIP-Seq reads mapped onto the Hcfc1 gene from control (0d) and Alb-Cre-ERT2tg; Hcfc1hepKO/Y livers 4 days after tamoxifen treatment (4d). TSS, transcription start site. (D) AST levels in control Hcfc1lox/Y (blue; n = 3/time point), Alb-Cre-ERT2tg; Hcfc1hepKO/+ (green; n = 3/time point), and Alb-Cre-ERT2tg; Hcfc1hepKO/Y (red; n = 3/time point) livers at 0, 4, 8, 14, and 17 days after tamoxifen treatment. (E) Macroscopic comparison of control liver (0d) and tamoxifen-treated knockout Alb-Cre-ERT2tg; Hcfc1hepKO/Y livers after 7, 14, and 18 days. Scale bar, 1 cm.](/cms/asset/d16f7a27-f8ae-4ed3-b1d5-ec4db69f74b6/tmcb_a_12276922_f0001.jpg)
FIG 2 Hcfc1hepKO/Y males display increased steatosis. (A) Steatosis was measured by Oil Red O staining of cryosections from control liver (0d) and tamoxifen-treated Alb-Cre-ERT2tg; Hcfc1hepKO/Y livers 4, 7, 14, and 18 days after treatment. Dotted lines outline hepatocyte clusters with reduced levels of fat accumulation. Scale bar, 50 μm. (B) Box plots of circulating triglyceride, total cholesterol, and HDL and LDL cholesterol levels in control Hcfc1lox/Y (n = 6) compared to Alb-Cre-ERT2tg; Hcfc1hepKO/Y (n = 6) livers 4 days after tamoxifen treatment. The differences between the levels of triglycerides (P value of 0.02), total cholesterol (P value of 4.2 × 10⁻⁴), and HDL (P value of 4.6 × 10⁻⁴) and LDL (P value of 1.13 × 10⁻⁵) cholesterol in control and knockout livers were significant.
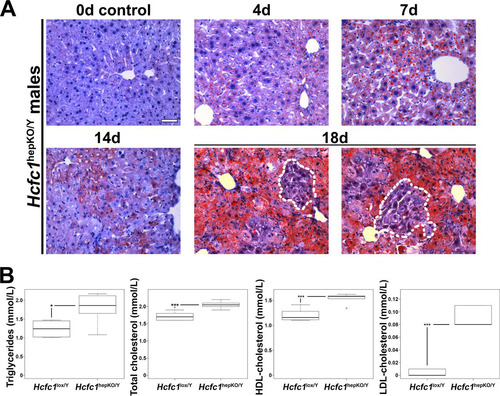
FIG 3 Hcfc1hepKO/Y males display characteristics typical of NASH by 18 days after tamoxifen treatment. (A to H) Comparison of paraffin-embedded sections (A to D and F to H) and cryosections (E) of control livers (0d; left) and Alb-Cre-ERT2tg; Hcfc1hepKO/Y livers 18 days after tamoxifen treatment (right). (A) Hematoxylin (blue) and eosin (pink) staining. Arrows point to hepatocytes with various nuclear sizes. (B) Sections stained with DAPI (blue) together with β-catenin (red) and HCF-1 (green) antibodies. (C) Hepatic glycogen visualized by PAS staining (purple). The sections were also stained with hematoxylin (blue). (D) DAB immunostaining for macrophage marker F4/80 (brown). The sections were also stained with hematoxylin (blue). (E) Cryosections stained with DAPI (blue) and CD-31 antibody (green). (F) Sections stained with DAPI (blue) and smooth-muscle α-actin (SMA; green) antibody. (G) Sections stained with Sirius red. The arrows point to collagen fibers. (H) TUNEL assay of apoptotic cells (red) costained with HCF-1 antibody (green). TUNEL-positive apoptotic cells are shown in red. (I) Electron microscopic images of control liver (0d) and knockout Alb-Cre-ERT2tg; Hcfc1hepKO/Y male liver samples 4, 7, and 14 days after tamoxifen treatment. Scale bars: 100 μm (A to H) and 2 μm (I).
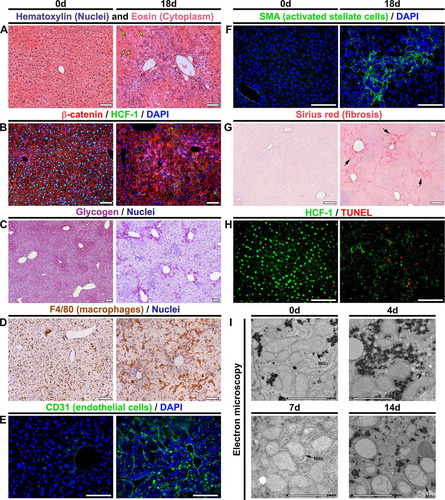
FIG 4 Hcfc1hepKO/Y male livers display reduced PGC1α protein levels. (A) The total Ppargc1a transcript expression level in control Hcfc1lox/Y (blue), Alb-Cre-ERT2tg; Hcfc1hepKO/+ (green), and Alb-Cre-ERT2tg; Hcfc1hepKO/Y (red) livers. RPKM, reads per kilobase of transcript per million mapped reads. (B) Immunoblotting with anti-PGC1α antibody and anti-U2AF65 antibody as a loading control with liver lysates of samples collected from control (0d) liver and Alb-Cre-ERT2tg; Hcfc1hepKO/Y male livers 7 days after tamoxifen treatment. M, molecular size (in kilodaltons). (C to E) Immunofluorescence analysis of paraffin-embedded sections from control (0d) liver (C) and Alb-Cre-ERT2tg; Hcfc1hepKO/Y male livers 7 (D) and 14 (E) days after tamoxifen treatment stained with DAPI (blue) and PGC1α (red) antibody (left) or PGC1α antibody alone (right). Arrowheads point to hepatocyte nuclei, and arrows point to non-hepatocyte cell nuclei. Scale bars, 50 μm.
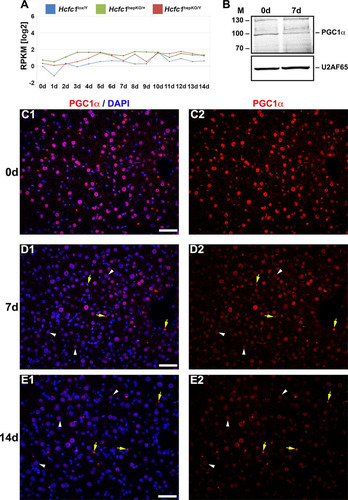
FIG 5 RNA-Seq and ChIP-Seq analyses of control and Hcfc1hepKO/Y male livers identify extensive alterations in gene expression upon loss of HCF-1. (A) Two-dimensional PCA plot of 15,616 expressed genes for control Hcfc1lox/Y male (day 0 [D00] to D14; blue), Alb-Cre-ERT2tg; Hcfc1hepKO/+ (D00 to D13, except D02 and D09; green), and Alb-Cre-ERT2tg; Hcfc1hepKO/Y (D00 to D14; red) livers after tamoxifen treatment. The coordinates of replicate samples were averaged and displayed as single dots, with two-dimensional standard deviations indicated with broken lines. Paths followed by the control male (blue), heterozygous female (green), and knockout male (red) liver transcriptomes are highlighted by ovals and arrows. (B) REVIGO display of functional enrichment analysis of 654 downregulated transcripts in Hcfc1hepKO/Y livers. The P value of the color key is given. (C) GSEA results for the 654 downregulated transcripts in Hcfc1hepKO/Y livers ranked by fold change (Hcfc1hepKO/Y versus Hcfc1lox/Y) for the four most statistically significant HALLMARK pathways. (D) Images of the HCF-1 ChIP-Seq profiles mapped on the Acly, March5, Mdh1, Mmachc, and neighboring bidirectional Acad8 and Thyn1 genes in control (0d; red) liver and Alb-Cre-ERT2tg; Hcfc1hepKO/Y (blue) male livers 4 days after tamoxifen treatment. (E) Pie charts displaying (from left to right) (i) the ratio of TSS- versus non-TSS-associated (±250 bp) HCF-1 peaks; (ii) the ratio of TSS-associated HCF-1 peaks with either a single or double (generally bidirectional) TSS; and (iii) the ratio of HCF-1-associated unidirectional or bidirectional transcription units. (F) Summary of the RNA-Seq and ChIP-Seq analyses.
![FIG 5 RNA-Seq and ChIP-Seq analyses of control and Hcfc1hepKO/Y male livers identify extensive alterations in gene expression upon loss of HCF-1. (A) Two-dimensional PCA plot of 15,616 expressed genes for control Hcfc1lox/Y male (day 0 [D00] to D14; blue), Alb-Cre-ERT2tg; Hcfc1hepKO/+ (D00 to D13, except D02 and D09; green), and Alb-Cre-ERT2tg; Hcfc1hepKO/Y (D00 to D14; red) livers after tamoxifen treatment. The coordinates of replicate samples were averaged and displayed as single dots, with two-dimensional standard deviations indicated with broken lines. Paths followed by the control male (blue), heterozygous female (green), and knockout male (red) liver transcriptomes are highlighted by ovals and arrows. (B) REVIGO display of functional enrichment analysis of 654 downregulated transcripts in Hcfc1hepKO/Y livers. The P value of the color key is given. (C) GSEA results for the 654 downregulated transcripts in Hcfc1hepKO/Y livers ranked by fold change (Hcfc1hepKO/Y versus Hcfc1lox/Y) for the four most statistically significant HALLMARK pathways. (D) Images of the HCF-1 ChIP-Seq profiles mapped on the Acly, March5, Mdh1, Mmachc, and neighboring bidirectional Acad8 and Thyn1 genes in control (0d; red) liver and Alb-Cre-ERT2tg; Hcfc1hepKO/Y (blue) male livers 4 days after tamoxifen treatment. (E) Pie charts displaying (from left to right) (i) the ratio of TSS- versus non-TSS-associated (±250 bp) HCF-1 peaks; (ii) the ratio of TSS-associated HCF-1 peaks with either a single or double (generally bidirectional) TSS; and (iii) the ratio of HCF-1-associated unidirectional or bidirectional transcription units. (F) Summary of the RNA-Seq and ChIP-Seq analyses.](/cms/asset/a63ac407-533f-4766-a032-ec083702e3f3/tmcb_a_12276922_f0005.jpg)
FIG 6 Combined RNA-Seq and ChIP-Seq analyses of control and Hcfc1hepKO/Y male livers identifies major alterations in expression levels of HCF-1-bound mitochondrion-related genes upon loss of HCF-1. (A) Heat map of upregulated (top) and downregulated (bottom) mitochondrial-cellular component (GO:0005739) gene-specific RNA levels whose corresponding TSS is bound by HCF-1 from 0 to 9 days after tamoxifen treatment in Alb-Cre-ERT2tg; Hcfc1hepKO/Y males. The color key indicates the associated Z-score. (B) Schematic of a mitochondrion showing functionally annotated genes whose TSS is HCF-1 bound and shows either upregulation (blue) or downregulation (red) upon loss of HCF-1. (C) Immunoblotting with anti-OXPHOS antibody cocktail and anti-U2AF65 loading control antibody with liver lysates of samples collected from control (0d) liver, and Alb-Cre-ERT2tg; Hcfc1hepKO/Y male livers 5 and 7 days after tamoxifen treatment.
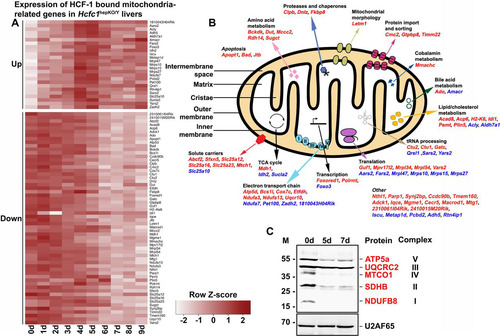
FIG 7 Progenitor cell population is activated in Hcfc1hepKO/Y male livers by 18 days after tamoxifen treatment. Immunofluorescence analyses of paraffin-embedded sections from Alb-Cre-ERT2tg; Hcfc1hepKO/Y male livers 18 days after tamoxifen treatment are shown. (A) Staining with DAPI (blue) and HCF-1 antibody (green). Both low and high magnifications of the same section are shown. The arrows point to distinct HCF-1-positive clusters. (B) Staining with DAPI (blue) as well as HNF4α (red) and HCF-1 (green) antibodies. The circle highlights a periportally located HNF4α- and HCF-1-positive hepatocyte cluster. (C) Staining with DAPI (blue) and HCF-1 (green) antibody and, in red, either Ki67 (top), PCNA (middle), or H3S10P (bottom) antibody. Arrows point to Ki67-positive, PCNA-positive, or H3S10P-positve hepatocytes that are also HCF-1 positive. (D) Staining with DAPI (blue) as well as Ki67 (red) and cytokeratin (green) antibodies. White arrows point to periportal Ki67- and cytokeratin-positive cells. The yellow arrow points to a cluster of cells with hepatocyte morphologies. pv, portal vein. Scale bars, 50 μm.
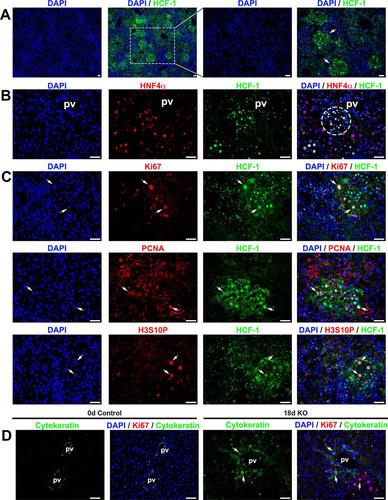
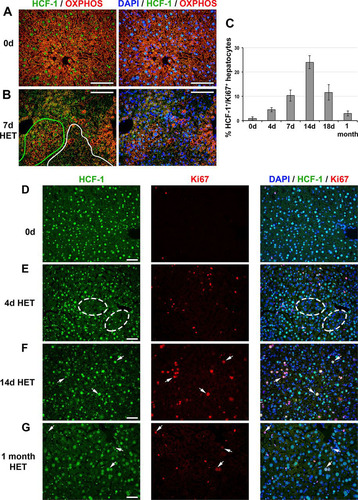
FIG 8 HCF-1-positive hepatocytes proliferate and replace HCF-1-negative hepatocytes in Hcfc1hepKO/+ heterozygous (HET) females. (A and B) Immunofluorescence analysis of paraffin-embedded sections from control (0d) liver (A) and Alb-Cre-ERT2tg; Hcfc1hepKO/+ liver 7 days after tamoxifen treatment (B) stained with DAPI (blue) as well as OXPHOS (red) and HCF-1 (green) antibodies. In panel B, HCF-1-positive (green) and HCF-1-negative (white) clusters are outlined. (C) Percentages of HCF-1-postive-hepatocytes that are Ki67 positive (cycling) in control (n = 3), and tamoxifen-treated Hcfc1hepKO/+ livers after 4 days (n = 3), 7 days (n = 3), 14 days (n = 2), 18 days (n = 3), and 1 month (n = 2). The differences between percentages of Ki67-positive HCF-1-positive hepatocytes between 0 and 4 days (P value of 0.006), 4 and 7 days (P value of 0.03), 7 and 14 days (P value of 0.03), 14 and 18 days (P value of 0.02), and 18 days and 1 month (P value of 0.03) after tamoxifen treatment were significant. (D to G) Immunofluorescence of paraffin-embedded sections from control (0d) liver (D) and Alb-Cre-ERT2tg; Hcfc1hepKO/+ livers 4 days (E), 14 days (F), and 1 month (G) after tamoxifen treatment stained with DAPI (blue) as well as HCF-1 (green) and Ki67 (red) antibodies. Ovals point to clusters of HCF-1-negative hepatocytes. Arrows point to HCF-1-positive, Ki67-positive hepatocytes. Scale bars, 100 μm.