Figures & data
TABLE 1 Peptide arrays
TABLE 2 Peptide array candidates methylated by PRMT1
FIG 1 Eya1 is a PRMT1 substrate. (A) Candidate peptides were arrayed for major myogenic determinant proteins, and the filter was incubated with recombinant GST-PRMT1 and [3H]S-adenosylmethionine for in vitro methylation assay. The 3H-positive spots represent the methylated peptides. Peptides from histones H2B and H4 were used as positive controls. A complete list of the peptides is found in . (B) HEK293T cells were cotransfected with MYC epitope-tagged PRMT1 and FLAG-tagged Eya1 or FLAG-YFP as control. Cell lysates were prepared, and immunoprecipitations were performed with M2–anti-FLAG beads. The bound proteins were separated by SDS-PAGE and immunoblotted with anti-FLAG, MYC, and ASYM26. TCL, total cell lysates; IB, immunoblot; IP, immunoprecipitation. (C) HEK293T cells were transfected with siLuciferase (siLuc) or siPRMT1 for 24 h. Then, cells were transfected with expression vectors for FLAG-Eya1 or FLAG-YFP. Cell lysates were prepared 48 h later, and coimmunoprecipitations were performed as described for panel B. See also and .
![FIG 1 Eya1 is a PRMT1 substrate. (A) Candidate peptides were arrayed for major myogenic determinant proteins, and the filter was incubated with recombinant GST-PRMT1 and [3H]S-adenosylmethionine for in vitro methylation assay. The 3H-positive spots represent the methylated peptides. Peptides from histones H2B and H4 were used as positive controls. A complete list of the peptides is found in Table 1. (B) HEK293T cells were cotransfected with MYC epitope-tagged PRMT1 and FLAG-tagged Eya1 or FLAG-YFP as control. Cell lysates were prepared, and immunoprecipitations were performed with M2–anti-FLAG beads. The bound proteins were separated by SDS-PAGE and immunoblotted with anti-FLAG, MYC, and ASYM26. TCL, total cell lysates; IB, immunoblot; IP, immunoprecipitation. (C) HEK293T cells were transfected with siLuciferase (siLuc) or siPRMT1 for 24 h. Then, cells were transfected with expression vectors for FLAG-Eya1 or FLAG-YFP. Cell lysates were prepared 48 h later, and coimmunoprecipitations were performed as described for panel B. See also Tables 1 and 2.](/cms/asset/67dfc2ab-7f6a-4049-9eef-6c1e1a2cd7b9/tmcb_a_12276143_f0001_oc.jpg)
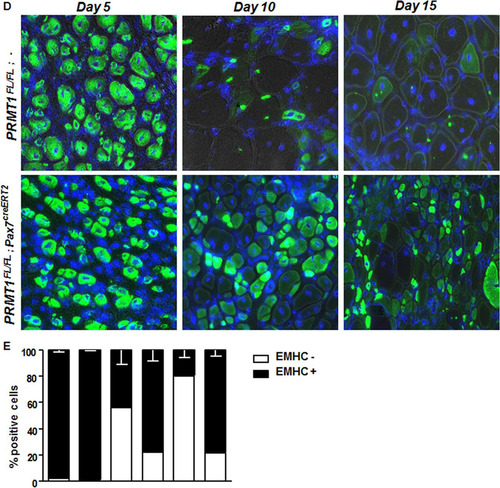
FIG 2 PRMT1 is expressed in quiescent and differentiating MSCs. (A) Immunofluorescence of tibialis anterior muscle cross-section from 6-week-old wild-type mice immunostained for PRMT1 and Pax7. The nuclei were stained with DAPI. (B) Differentiation assay of MACS-isolated MSCs fixed right after isolation (day 0) or cultured for 3 to 5 days prior to fixation, immunostained for PRMT1 and Pax7, and visualized by fluorescence microscopy. The nuclei were stained with DAPI. (C) Cell lysates were prepared from MACS-isolated MSCs 0, 3, and 5 days in culture and immunoblotted with anti-PRMT1 or anti-MyoD. Ponceau red staining of a band is shown to confirm equivalent loading. (D) RNA was extracted from MACS-isolated MSCs at 0, 3, and 5 days of culture, and the levels of PRMT1 were measured by RT-qPCR and normalized to the average of GAPDH, R18S, and TBP.
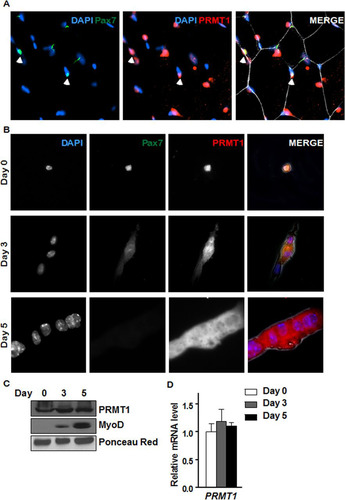
FIG 3 PRMT1-deficient muscle stem cells have myogenic defects. (A) Schematic representation of PRMT1 deletion in MSCs and work flow for MSC isolation and culturing. (B) MSCs were isolated and pooled from three PRMT1FL/FL; Pax7CreERT2/+ and three PRMT1FL/FL; − mice after 4-OHT injections. The cells were cultured for 3 days in medium supplemented with 50 nM 4-OHT prior to fixation and immunostaining for PRMT1 and Pax7 and visualized by fluorescence microscopy. (C) MSC lysates after 3-day culturing were separated by SDS-PAGE, and the levels of PRMT1-methylated proteins were determined by immunoblotting with anti-PRMT1 and ASYM26. Ponceau red staining of a band is shown to confirm equivalent loading. (D) Quantification of PRMT1, Pax7, and MyoD mRNA levels by RT-qPCR of the indicated MSCs 3 days after culturing. Values were normalized to the averages of GAPDH, R18S, and TBP. (E) Representative images of MSCs immunostained for Pax7 and Myf5 from days 0 and 3 after culturing. **, P < 0.01; ***, P < 0.001.
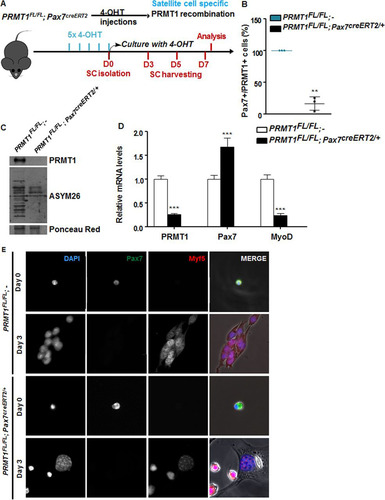
FIG 4 PRMT1 controls MyoD expression via mediation of Eya1/Six1 activity. (A) Relative (R.) levels of DNA from ChIP of Eya1 at MyoD, Eya1, and Six1 upstream promoter region (approximately bp −500) normalized to input and IgG. (B) Relative levels of DNA from ChIP of Six1 at MyoD, Eya1, and Six1 upstream promoter region (approximately bp −500) normalized to input and IgG. (C) Relative levels of DNA from ChIP of the histone mark H3K4me3 at MyoD, Eya1, and Six1 upstream promoter region (approximately bp −500) normalized to H3. (D) C2C12 cell were differentiated for days 0, 3, and 5, and the mRNA levels of PRMT1 and Eya1 were measured by RT-qPCR and normalized to the average of GAPDH, R18S, and TBP. (E) A representative differential interference contrast image of C2C12 cultures after transfection with siLuciferase (siLuc) or siEya1 under differentiation conditions. (F) mRNA levels of Eya1, Pax7, Myf5, and MyoD were measured by RT-qPCR and normalized to GAPDH, R18S, and TBP in C2C12 transfected with siLuc or siEya1, harvested as undifferentiated (day 0) or after 3 days of culture in differentiation medium (day 3). *, P < 0.05; **, P < 0.01; ***, P < 0.001; n.s., not significant.
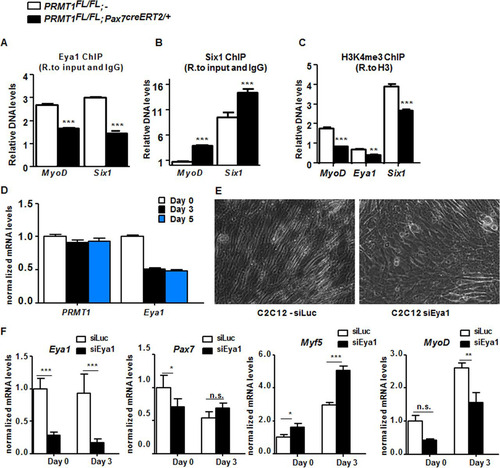
FIG 5 Cultured PRMT1-deficient MSCs display enhanced proliferation and impaired differentiation. (A) Representative images of MSCs immunostained for Pax7 (green) and Ki67 (red) and visualized by fluorescence microscopy. DAPI is blue. MSCs were cultured for 1, 3, or 5 days in proliferative medium. (B) Quantification of Pax7- and Ki67-positive cells as shown in panel A. For each condition, statistics were performed based on technical triplicates and counting >100 nuclei. Double-negative nuclei are not accounted for in this analysis. WT, wild type; KO, knockout. (C) Percentages of double-positive MSCs (Pax7+ Ki67+) after day 5 culturing with the indicated genotype. (D) Representative images of MSCs immunostained for Pax7 and troponin after 7 days of culture in differentiation medium. (E) The fusion index was calculated as the ratio of the number of myonuclei over the number of total nuclei in the field. For each condition, statistics were performed based on technical triplicates and counting >300 nuclei. (F) Average number of nuclei/fiber in each field after MSC day 7 of differentiation. For each condition, statistics were performed based on technical triplicates and counting >300 nuclei. This represents the ratio of the number of myonuclei over the total number of myofibers present in the field. *, P < 0.05; **, P < 0.01; ***, P < 0.001.
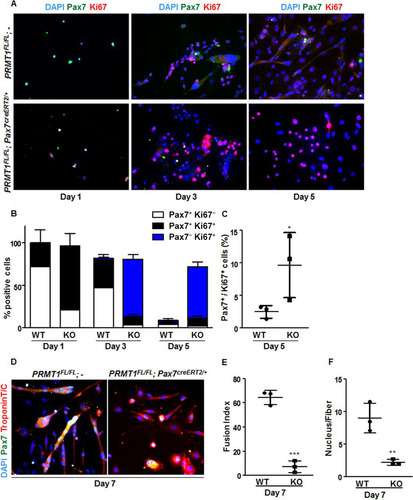
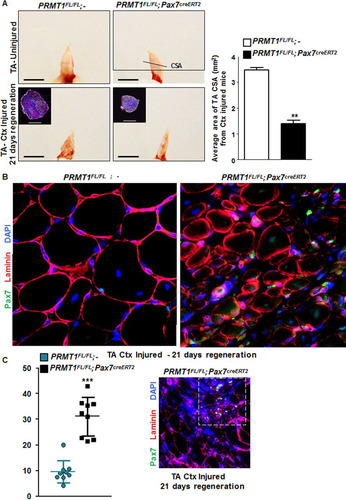
FIG 6 Adult PRMT1FL/FL; Pax7CreERT2/+ mice have impaired muscle regeneration following cardiotoxin-induced injury. (A) (Left) Representative images of injured or uninjured tibialis anterior (TA) from PRMT1FL/FL; Pax7CreERT2/+ and PRMT1FL/FL; − mice extracted 21 days after Ctx injection. The injured TA muscles were cryosectioned at the cross-section area (CSA) (lower images, top left corner), which was measured using nine mice of each genotype. White bar, 100 μm; black bar, 1 cm. (Right) For each mouse, five cross sections were analyzed and the average was calculated to be representative of the samples. (B) The injured TA muscles of the indicated genotypes were cryosectioned, freshly fixed, and immunostained for Pax7 and laminin to assess regeneration. (C) (Left) Quantification of the Pax7-positive cells per fiber after regeneration in PRMT1FL/FL; Pax7CreERT2/+ and PRMT1FL/FL; − mice TA cross sections; (right) representative image from Pax7CreERT2/+ and PRMT1FL/FL; − TA section after regeneration to show a hot spot of proliferative Pax7-positive cells. (D) Injured TA cross sections from PRMT1FL/FL; Pax7CreERT2/+ and PRMT1FL/FL; − mice extracted at days 5, 10, and 15 after Ctx injection. Injured TA were cryosectioned at the cross section area and stained for embryogenic myosin heavy chain (EMHC) to index regeneration. For each time point, three mice of each genotype were used. (E) Quantification of the EMHC-positive and -negative regenerating fibers in PRMT1FL/FL; Pax7CreERT2/+ and PRMT1FL/FL; − TA cross sections. For each time point, three mice of each genotype were used. For each sample, analysis was performed using the average of positive/negative EMHC fibers from three pictures to be representative of the sample. **, P < 0.01; ***, P < 0.001.