Figures & data
FIG 1 Differentially expressed transcripts in Zfp36aa/aa M-BMMs. M-BMMs were generated from 3 Zfp36+/+ and 3 Zfp36aa/aa mice and treated with 10 ng/ml LPS for 1 h (A) or 4 h (B). RNA was isolated, and transcript abundance was analyzed by using Agilent microarrays and Partek Genomics Suite. Transcripts expressed above an arbitrary threshold of 200 RMA in at least two replicates and demonstrating upregulation by LPS (>2 times; P < 0.05) were selected for display. Data are illustrated in the form of volcano plots, in which transcripts with a >1.5-fold difference in expression levels between Zfp36+/+ and Zfp36aa/aa M-BMMs and a corrected P value of <0.05 are shaded black. Underexpressed transcripts are to the left of the origin. Several transcripts are highlighted.
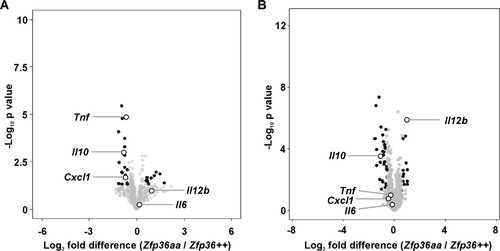
FIG 2 Expression of TNF, IL-10, IL-6, and IL-12p40 proteins by Zfp36+/+ and Zfp36aa/aa M-BMMs. Matched Zfp36+/+ and Zfp36aa/aa M-BMMs were cultured in 24-, 12-, or 6-well dishes and stimulated with 10 ng/ml LPS for 4 h. ELISAs or multiplex bead assays were used to measure TNF (A), IL-10 (B), IL-6 (C), and IL-12p40 (D) levels. In the cases of TNF and IL-6, 5 of 14 experiments employed matched Zfp36+/+ and Zfp36aa/aa littermates. All other experiments employed at least three mice of each genotype, with mean cytokine concentrations being plotted. Cytokine quantities expressed by matched Zfp36+/+ and Zfp36aa/aa M-BMMs or sets of M-BMMs are connected by lines. The graphs on the right show mean cytokine expression levels in Zfp36aa/aa M-BMMs relative to those in matched Zfp36+/+ controls. n.s., not statistically significant; ***, P < 0.005; **, P < 0.01 (by a Wilcoxon matched-pair test).
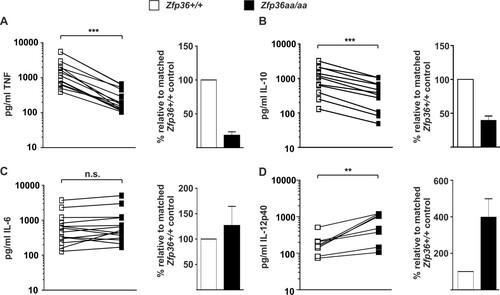
FIG 3 Regulation of inflammatory mediators by DUSP1 and TTP. Wild-type, Dusp1−/−, Zfp36aa/aa, and Dusp1−/−-Zfp36aa/aa M-BMMs were stimulated with 10 ng/ml LPS for 1 h or 4 h. Expression levels of selected mRNAs were determined by microarray analysis (A), and the levels of the corresponding proteins were measured by an ELISA or a multiplex bead assay (B). Graphs represent means ± standard errors of the means of data from 3 independent M-BMM cultures. n.s., not statistically significant; *, P < 0.05; **, P < 0.01; ***, P < 0.005 (by one-way ANOVA). The microarray experiment used to generate the data in panel A was previously described (Citation52).
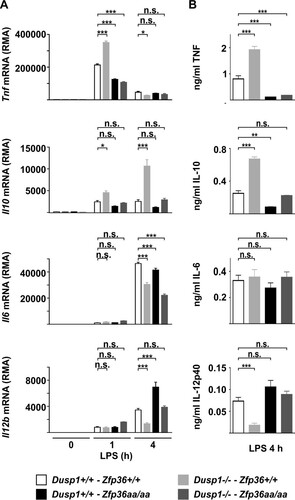
FIG 4 TTP mutation affects gene expression at different levels. Zfp36+/+ and Zfp36aa/aa M-BMMs were treated with LPS for the times indicated, supernatants were collected, and RNA was isolated. (A) Steady-state mRNA abundance was measured by quantitative PCR. (B) Levels of primary transcripts were measured by quantitative PCR. (C) Actinomycin D (AmD) chase experiments were performed at the peak of gene expression (1 h in the case of Tnf and 4 h in the cases of Il10, Il6, and Il12b). (D) Levels of secreted proteins were measured by an ELISA or a multiplex bead assay. Graphs represent means ± standard errors of the means of data from three independent M-BMM cultures in each case. Pairwise comparisons that showed no statistical significance are not indicated. *, P < 0.05; **, P < 0.01; ***, P < 0.005 (by a Mann-Whitney test).
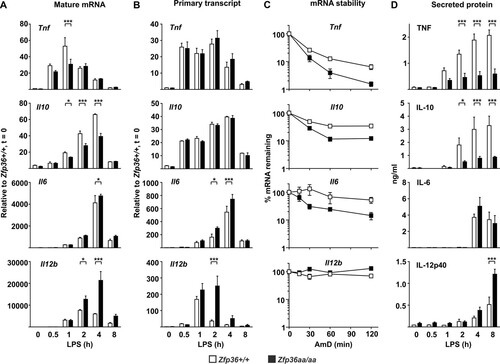
FIG 5 Dose-dependent inhibition of proinflammatory gene expression by IL-10. Il10−/− M-BMMs were stimulated with 10 ng/ml LPS for 4 h in the presence of different concentrations of recombinant IL-10. TNF, IL-6, and IL-12p40 levels were quantified by an ELISA. Cytokine levels were normalized against those in the absence of IL-10. The graph shows means ± standard errors of the means of data from at least 8 independent M-BMM cultures.
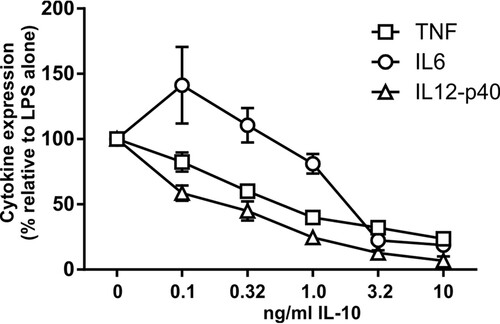
FIG 6 Differential gene expression in Zfp36+/+ and Zfp36aa/aa M-BMMs and GM-BMMs. Macrophages were differentiated from bone marrow of Zfp36+/+ and Zfp36aa/aa mice in the presence of either M-CSF of GM-CSF and treated with 10 ng/ml LPS for 4 h. Cytokine levels were measured by an ELISA or a multiplex bead assay. Graphs represent means ± standard errors of the means from 4 independent cultures (TNF, IL-10, and IL-12p40) or 7 independent cultures (IL-6). n.s., not statistically significant; *, P < 0.05 (by a Mann-Whitney test).
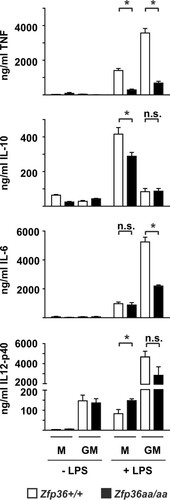
FIG 7 Endogenous IL-10 differentially affects the expression of proinflammatory cytokines. Zfp36+/+ and Zfp36aa/aa M-BMMs were treated with 10 ng/ml LPS for 4 h (TNF and IL-6) or 8 h (IL-12p40) in the presence of 10 μg/ml IL-10-neutralizing antibody or an isotype control. Cytokine levels were measured by a multiplex bead assay or an ELISA. Graphs represent means ± standard errors of the means from 4 independent M-BMM cultures. n.s., not statistically significant; ***, P < 0.005 (by a Mann-Whitney test).
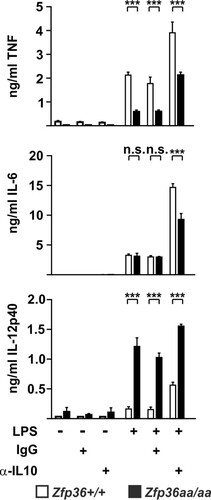
FIG 8 In vivo responses to LPS are broadly impaired in Zfp36aa/aa mice. Zfp36+/+ and Zfp36aa/aa mice were injected intraperitoneally with 5 mg/kg LPS and humanely sacrificed after 3 or 12 h. Serum cytokine levels were measured by a multiplex bead assay or an ELISA. Graphs represent means ± standard errors of the means for 5 untreated mice and 10 LPS-injected mice at each time point. *, P < 0.05; **, P < 0.01; ***, P < 0.005 (by a Mann-Whitney test). The IL-10 and TNF measurements (indicated by †) were previously reported (Citation53).
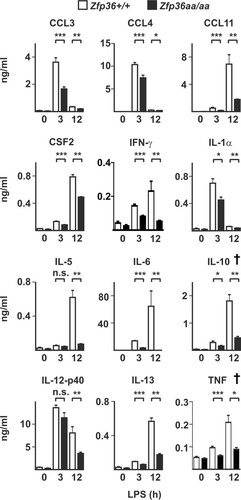
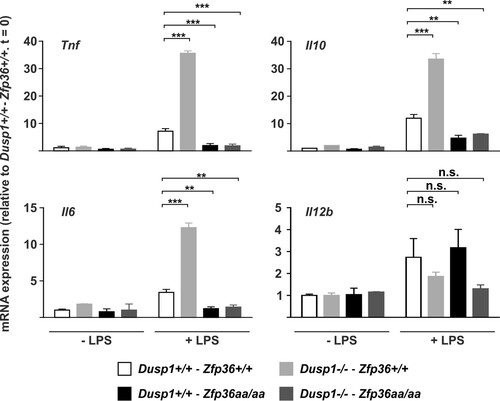
FIG 9 Regulation of cytokine expression by the DUSP1-TTP axis in vivo. Dusp1+/+-Zfp36+/+, Dusp1−/−-Zfp36+/+, Dusp1+/+-Zfp36aa/aa, or Dusp1−/−-Zfp36aa/aa mice were injected intraperitoneally with 5 mg/kg LPS and humanely sacrificed after 3 h. Spleens were excised, RNA was prepared, and the levels of the indicated transcripts were quantified by qPCR, with normalization against B2m mRNA levels and then against the untreated wild-type (Dusp1+/+-Zfp36+/+) control. Graphs represent means ± standard errors of the means for 2 untreated and 4 LPS-treated mice of each genotype. n.s., not statistically significant; **, P < 0.01; ***, P < 0.005 (by ANOVA).