Figures & data
FIG 1 Control of GH and PRL hormones and transcripts by hnRNP L and hnRNP LL in GH3 pituitary cells. (A and B) Representative Western blots of the cellular and secreted prolactin and growth hormone of the GH3 cells with or without hnRNP L or LL knockdown (shL or shLL)/rescue (shL + L or shLL + LL), respectively, with hnRNP F/H as a loading control. pLKO.1 and pCppt2E, vector controls for shLL and Myc-hnRNP LL, respectively. *, Flag-tagged hnRNP L. In panel B, endogenous (Endo.) and overexpressed (Ovexp.) hnRNP LL are indicated to the right of the gel. (C and D) Agarose gels of the RT-PCR products of Gh1 and Prl in the GH3 cells shown in panels A and B. −, PCR or RT negative control; Actb, RNA loading control. (E) PCR linearity test by cycle numbers for the Prl and Gh1 genes. Agarose gels of the products from PCR cycles 25 to 34 and plots of the product intensity versus cycle numbers are shown.
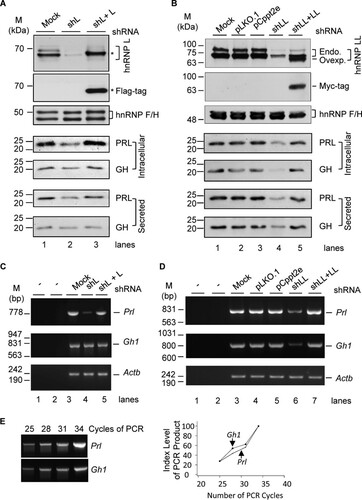
FIG 2 Profiles of transcripts and alternative exons controlled by hnRNP L and LL in GH3 cells. (A) Pie-shaped percent distribution of genes with fold changes of less than 0.5 or more than 2.0 (P < 0.05) and average read numbers of at least 50. (B) Representative agarose gels of RT-PCR products of a group of hormone or hormone-related genes differentially expressed in the knockdown samples. Adm, adrenomedullin; Ghrl, ghrelin; Ins2 e3, insulin 2, exon 3; Insl6, insulin-like 6; Atp2b2, ATPase, Ca2+ transporting, plasma membrane 2; Car9, carbonic anhydrase 9; Fstl3, follistatin like 3; Actb (beta-actin), RNA loading control; −, PCR or RT negative control. (C) Pie-shaped percent distribution of alternative exons changed by shL, shLL, or both. (D) Examples of alternative exons specifically changed by shL or shLL. Lines, introns; gray boxes, constitutive exons; black boxes, alternative exons; arrows, PCR primers; Abhd3, abhydrolase domain containing 3; Kif1b, kinesin family member 1b. (E) DAVID function clustering analysis of the most significantly clustered functions of genes changed at transcript or exon levels specifically by shL or shLL. **, P < 0.01; ***, P < 0.001.
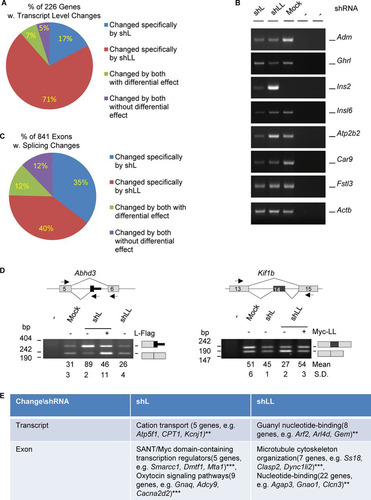
FIG 3 hnRNP L-specific effect on the usage of a 93-nt cryptic exon of Prl. (A) A high-contrast, long-exposure image of an agarose gel of the RT-PCR products of Prl in GH3 cells. Identities of the different Prl products are to the right of the gel. Note that this gel highlights the longer Prl product and is not quantitative regarding the Prl level compared to that depicted in . (B) Diagram of the Prl variants detected in GH3 cells with different expression levels of hnRNP L. Lines, introns; boxes, exons; narrower boxes, untranslated regions; blue box, the intron piece (cryptic exon) retained in the shL sample. (C) Sequencing chromatogram of the Prl + 93-nt band in the gel shown in panel A. Inclusion of a 93-nt cryptic exon between exons 4 and 5 of Prl caused a 31-aa (amino acid) insertion in the PRL protein. (D) Diagram of the Prl splicing reporter minigenes cloned into the vector DUP175. Black bars and triangles, CA-rich motifs; horizontal lines, introns; blue box, the 93-nt cryptic exon. Test results of the 93-nt usage in the HEK293T cells are on the right. Arrowheads indicate the location of PCR primers. (E) hnRNP L specifically inhibits splicing of the 93-nt cryptic exon. Shown is an agarose gel of the RT-PCR products of Prl minigenes from HEK293T cells with or without hnRNP L or LL knockdown and rescue. Relative amounts of the shRNA viruses used for transduction are 30 μl and 90 μl. Identities of the PCR bands are to the right. (F) UV cross-linking assay of the [α-32P]CTP-labeled Prl RNA probes in HeLa nuclear extracts, followed by immunoprecipitation (IP) with anti-hnRNPL. (Top) CA-rich motifs of the Prl RNA probes. (Bottom) Phosphor images of the cross-linked and IP proteins in SDS-PAGE gels. *, uncharacterized protein, likely PTBP1, with increased binding to the mutated sequence motif UCUU, UUCU, or CUCU in M1, as also observed in similar cases by Cao et al. (Citation81). The full 68-nt probe sequence is described in Materials and Methods.
![FIG 3 hnRNP L-specific effect on the usage of a 93-nt cryptic exon of Prl. (A) A high-contrast, long-exposure image of an agarose gel of the RT-PCR products of Prl in GH3 cells. Identities of the different Prl products are to the right of the gel. Note that this gel highlights the longer Prl product and is not quantitative regarding the Prl level compared to that depicted in Fig. 1. (B) Diagram of the Prl variants detected in GH3 cells with different expression levels of hnRNP L. Lines, introns; boxes, exons; narrower boxes, untranslated regions; blue box, the intron piece (cryptic exon) retained in the shL sample. (C) Sequencing chromatogram of the Prl + 93-nt band in the gel shown in panel A. Inclusion of a 93-nt cryptic exon between exons 4 and 5 of Prl caused a 31-aa (amino acid) insertion in the PRL protein. (D) Diagram of the Prl splicing reporter minigenes cloned into the vector DUP175. Black bars and triangles, CA-rich motifs; horizontal lines, introns; blue box, the 93-nt cryptic exon. Test results of the 93-nt usage in the HEK293T cells are on the right. Arrowheads indicate the location of PCR primers. (E) hnRNP L specifically inhibits splicing of the 93-nt cryptic exon. Shown is an agarose gel of the RT-PCR products of Prl minigenes from HEK293T cells with or without hnRNP L or LL knockdown and rescue. Relative amounts of the shRNA viruses used for transduction are 30 μl and 90 μl. Identities of the PCR bands are to the right. (F) UV cross-linking assay of the [α-32P]CTP-labeled Prl RNA probes in HeLa nuclear extracts, followed by immunoprecipitation (IP) with anti-hnRNPL. (Top) CA-rich motifs of the Prl RNA probes. (Bottom) Phosphor images of the cross-linked and IP proteins in SDS-PAGE gels. *, uncharacterized protein, likely PTBP1, with increased binding to the mutated sequence motif UCUU, UUCU, or CUCU in M1, as also observed in similar cases by Cao et al. (Citation81). The full 68-nt probe sequence is described in Materials and Methods.](/cms/asset/56accc6d-8c9e-4ddd-9d10-4bee8157ace4/tmcb_a_12276789_f0003.jpg)
FIG 4 Transcriptome-wide analysis of intronic reads changed by shL or shLL. (A) Dot plots showing the number of reads of the 100-bp bins in shL (red) or shLL (blue) versus that in mock-treated cells. The yellow oval highlights bins upregulated at least 4-fold by shL/M. For comparison, the corresponding reads of bins in the shLL (left, changed by shL) or shL (right, changed by shLL) samples are also shown in each panel. (B) Types of alternative splicing represented by 416 shL-upregulated bins with ≥4-fold changes. ss, splice site. (C) Representative IGV views of the profiles of the RNA-Seq reads mapped to the predicted regions specifically in shL samples by edgeR intronic analysis. (Upper) Cryptic last exon of TMEM130 gene. (Lower) Cryptic cassette exon of Parp9 gene. Red boxes, the intronic cryptic exons; arrows, gene direction. The consequences of usage of the intronic sequences are at the bottom of each panel. The narrower boxes are 3′ UTRs. (D) RT-PCR validation of the predicted intronic RNA-Seq reads. Shown are agarose gels of RT-PCR products of seven genes tested (representative of at least 3 gels per gene with P < 0.001 for all except Stag2 [P < 0.01]). −, PCR negative control. To the left of the gels are the sizes of DNA markers (in base pairs), and to the right are the splicing patterns of the cryptic exons (red boxes) and gene names. (E) Effect of cycloheximide (100 μg/ml) on the cryptic NMD exon of Parp9 upon knockdown of hnRNP L by shL. *, product likely from an alternative cryptic splice site in the same exon. (F) DAVID functional annotation clustering of the affected genes for ATPase or nucleotide-binding functions. The genes coding for membrane or signaling proteins are underlined, and those critical for PRL release are in boldface.
![FIG 4 Transcriptome-wide analysis of intronic reads changed by shL or shLL. (A) Dot plots showing the number of reads of the 100-bp bins in shL (red) or shLL (blue) versus that in mock-treated cells. The yellow oval highlights bins upregulated at least 4-fold by shL/M. For comparison, the corresponding reads of bins in the shLL (left, changed by shL) or shL (right, changed by shLL) samples are also shown in each panel. (B) Types of alternative splicing represented by 416 shL-upregulated bins with ≥4-fold changes. ss, splice site. (C) Representative IGV views of the profiles of the RNA-Seq reads mapped to the predicted regions specifically in shL samples by edgeR intronic analysis. (Upper) Cryptic last exon of TMEM130 gene. (Lower) Cryptic cassette exon of Parp9 gene. Red boxes, the intronic cryptic exons; arrows, gene direction. The consequences of usage of the intronic sequences are at the bottom of each panel. The narrower boxes are 3′ UTRs. (D) RT-PCR validation of the predicted intronic RNA-Seq reads. Shown are agarose gels of RT-PCR products of seven genes tested (representative of at least 3 gels per gene with P < 0.001 for all except Stag2 [P < 0.01]). −, PCR negative control. To the left of the gels are the sizes of DNA markers (in base pairs), and to the right are the splicing patterns of the cryptic exons (red boxes) and gene names. (E) Effect of cycloheximide (100 μg/ml) on the cryptic NMD exon of Parp9 upon knockdown of hnRNP L by shL. *, product likely from an alternative cryptic splice site in the same exon. (F) DAVID functional annotation clustering of the affected genes for ATPase or nucleotide-binding functions. The genes coding for membrane or signaling proteins are underlined, and those critical for PRL release are in boldface.](/cms/asset/8b05bd84-4c37-4c44-a967-54f4ed765a3d/tmcb_a_12276789_f0004.jpg)
FIG 5 Comparison of the evolutionarily diverged PRR of rat hnRNP L with the same region of L and LL of other representative species (A) and the role of PRR in preventing aberrant splicing by hnRNP L (B to D). (A) Location of the PRR in the structural domains of rat hnRNP L and the aligned corresponding regions of different species using Clustal W. The diagram is drawn to scale. Amino acids different from the rat ones are shaded. *, invertebrate proteins have significantly higher percent identity to vertebrate hnRNP L than LL (39% versus 35%, P < 0.001, n > 40 pairs of proteins), using the same species as in reference Citation15; therefore, they are indicated as hnRNP L. The amino acid numbers are according to rat GenBank accession number EDM07871, as in the hnRNP L-Flag in this study. (B) Domain differences between the exogenous proteins of wild hnRNP L-Flag, hnRNP L-Flag with PRR deletion, and Myc-hnRNP LL. Above the domains is the deleted sequence of the PRR with prolines (P) underlined. Dotted box, Flag tag. (C) Western blots showing expression of the hnRNP L-WT-Flag (WT) and PRR deletion mutant L-ΔP-Flag (ΔP) in shL-transduced GH3 cells. (D) Representative examples of the cryptic exons in shL cells coexpressing WT or ΔP with a significant difference between the two hnRNP L proteins. Shown are splicing modes around the cryptic exons (upper) and agarose gels of the RT-PCR products (lower), with the inclusion level of the cryptic exons below each lane. Lines, introns; gray boxes, exons; red boxes, cryptic exons; arrows, PCR primers. Splicing modes are depicted with solid (normal) or dotted (cryptic) diagonal lines. Diagrams of the spliced products are to the right of the gels. The Prl cryptic product was amplified with an additional primer (star) in the 93-nt exon. The product from this primer was counted as the cryptic product.
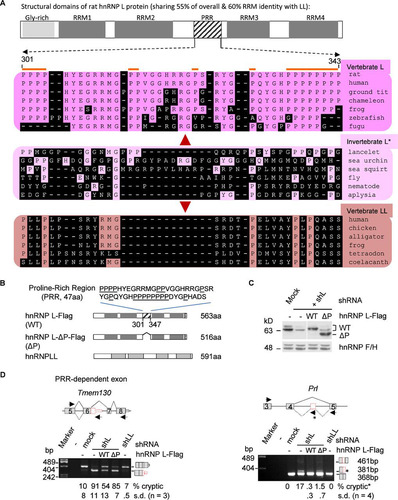
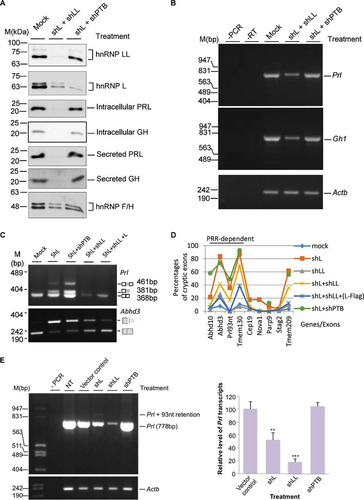
FIG 6 Effects of double knockdown of hnRNP L and LL or its known PRR-binding partner hnRNP I (PTBP1) on hormone production and the usage of cryptic exons. (A) Western blots of the splicing factors and hormones in GH3 cells with double knockdown of hnRNP L and LL or L and PTBP1 (shPTB). hnRNP F/H, protein loading control. Mock, mock transduced. (B) Agarose gels of the RT-PCR products of Gh1 and Prl transcripts in the double knockdown cells. (C) Agarose gels of RT-PCR products of Prl and Adh3 transcripts in single or double knockdown GH3 cells. Note that the Prl level is low in shL+shLL samples; therefore, to make sure the Prl93nt band is detected, a third (reverse) primer binding to the end of the 93-nt cryptic exon was included at a ratio of 10:1 to the downstream reverse primer. (D) Effect of double knockdowns of hnRNP L and LL or hnRNP L and PTBP1 on all the tested cryptic exons. (E, left) agarose gels of RT-PCR products of the Prl transcript in GH3 cells upon knockdown of PTBP1 (shPTB) compared with that of hnRNP L or LL. To the left are DNA size markers. (Right) Bar graph of the relative percentage of the Prl transcript. Data are means ± standard deviations; n = 3; **, P < 0.01; ***, P < 0.001. −PCR or −RT, PCR or RT negative control; NT, nontreated GH3 cells.