Figures & data
FIG 1 Gene-specific Mediator association. (A) Schematic diagram of Mediator subunit organization. Underlined subunits (with their original nomenclature [Citation43]) were used as ChIP targets in this study. The darker-green ovals represent the components of the tail module triad Med2-Med3-Med15. (B to D) Normalized occupancy profiles for Pol II and the indicated Mediator subunits in wild-type yeast. (E) Mediator signal, averaged over promoters (left) and ORFs (right) for Med17 from the head module and Med2 from the tail module, in reads per million (RPM), is plotted against log2(expression level) (Citation26). Genes were sorted first on the basis of expression level and second by Mediator signal and binned into 20-gene groups for clarity.
![FIG 1 Gene-specific Mediator association. (A) Schematic diagram of Mediator subunit organization. Underlined subunits (with their original nomenclature [Citation43]) were used as ChIP targets in this study. The darker-green ovals represent the components of the tail module triad Med2-Med3-Med15. (B to D) Normalized occupancy profiles for Pol II and the indicated Mediator subunits in wild-type yeast. (E) Mediator signal, averaged over promoters (left) and ORFs (right) for Med17 from the head module and Med2 from the tail module, in reads per million (RPM), is plotted against log2(expression level) (Citation26). Genes were sorted first on the basis of expression level and second by Mediator signal and binned into 20-gene groups for clarity.](/cms/asset/50d7e49e-aa49-4839-8f01-8effbd31246e/tmcb_a_12275488_f0001_oc.jpg)
TABLE 1 Yeast strains used in this study
TABLE 2 Primers used in this study
TABLE 3 Summary of ChIP-seq experiments
FIG 2 Gene occupancy by Mediator subunits and Pol II in wild-type and med17 ts yeast. Heat maps and occupancy profiles are shown for the indicated Mediator subunits and Pol II, normalized and corrected for no-antibody control, for the 300 most highly transcribed genes (Citation26). Occupancy profiles show normalized reads per million; the x axis shows “stretched” genic regions, normalized for length, flanked by regions ±3 kb.
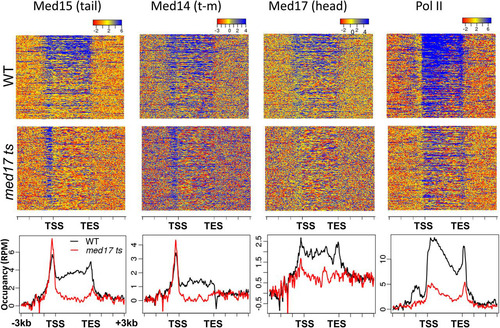
FIG 3 Dependence of Mediator and Pol II occupancy on Med17 (A) and on the tail module triad (B). Normalized occupancy profiles are shown for Pol II or Mediator subunits, as indicated, in wild-type and med17 ts yeast (A) or wild-type and med3Δ med15Δ yeast (B), at the PMA1 and RPL3 loci. (A) Control no-antibody occupancy profiles are shown from wild-type and med17 ts yeast as well. Occupancy profiles are normalized between each wild type and corresponding mutant to allow direct comparison, and the no-antibody control samples are normalized to the same scale as the Med17 profiles in panel A, which displays the lowest signal among the Mediator subunit ChIP targets. Blue bars indicate ORFs, and arrowheads indicate the direction of the transcripts. YGL007W is a dubious ORF that contains a Rap1 binding site required for PMA1 activation (Citation44).
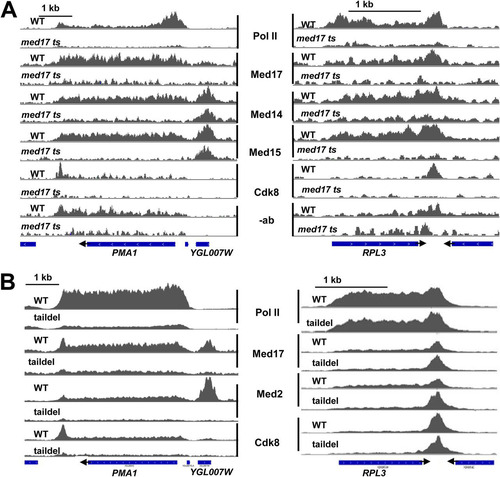
FIG 4 Distinct Mediator occupancy patterns at SAGA-regulated and TFIID-regulated (TF) genes. (A) Average Pol II occupancy profiles for the 1,000 genes showing highest expression, normalized for length of the transcribed sequence, and divided into SAGA-regulated (195 genes) and TFIID-regulated (781 genes) genes, as indicated. Top, profiles are shown for wild-type and med3Δ med15Δ yeast; bottom, profiles are shown for wild-type and med17 ts yeast. We do not know the cause for the enrichments seen at the 5′ end of ORFs in the bottom panel and not in the upper panel, but note that these profiles are from yeast shifted to 37°C for 1 h, whereas the profiles in the upper panel are from yeast grown at 30°C. (B) Pol II occupancy, given as the average intensity in reads per million (RPM) over the gene body, plotted for all genes in med3Δ med15Δ yeast against wild-type yeast; (C) average Med2 occupancy profiles, as described for panel A, in wild-type and med3Δ med15Δ yeast for the 1,000 genes showing highest and lowest expression; (D) average Med15 occupancy profiles in wild-type and med17 ts yeast for the 1,000 genes showing highest expression; (E) ChIP signal for GFP (using data from reference Citation13) expressed in yeast grown in galactose medium, plotted for the 1,000 most highly expressed genes, normalized for length, and separated into SAGA-regulated and TFIID-regulated (TF) genes.
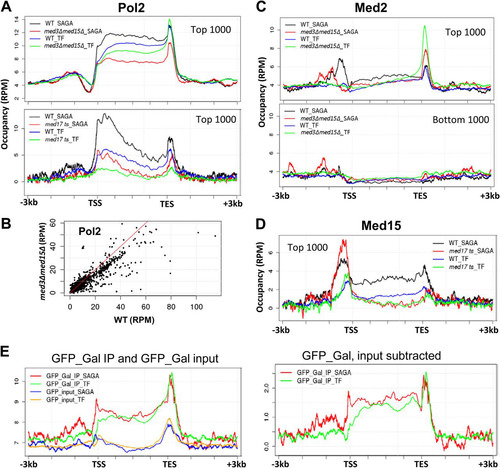
FIG 5 Peaks of Med2 occupancy are found primarily in intergenic regions and are associated with genes varying in expression. (A) Overlap among occupancy peaks for Med2, Med17, and Cdk8. Because more than one peak for a given subunit can overlap a peak from another, the numbers in the overlap regions do not add up exactly to the number of peaks for each subunit. (B) Med2 peaks of <2 kb in width were sorted into those overlapping and not overlapping Pol II peaks or Pol III transcripts. (C) Normalized occupancy profiles for Mediator subunits and Pol II showing examples of Med2 peaks located between divergent, tandemly oriented, or convergent genes or overlapping dubious ORFs. (D) Normalized Med15, Med14, and Med17 average occupancy in RMY511 and RMY513 wild-type yeast centered on the 146 Med2 peaks as indicated in panel B. (E) Med2 and Med17 occupancy from reference Citation23 for the 228 Med2 peaks indicated in panel B, divided into low (med2cov < 5) and high (med2cov > 5) Med2 peaks. (F) Genes having promoters associated with Med2 peaks (med2cov > 5) were identified and plotted according to their ranking for expression level (Citation14), from highest (quintile 1) to lowest (quintile 5).
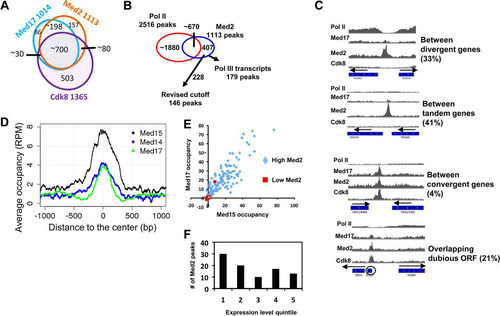
TABLE 4 Transcription factors enriched at intergenic Med2 peaks from CERES (Citation31)Table Footnotea
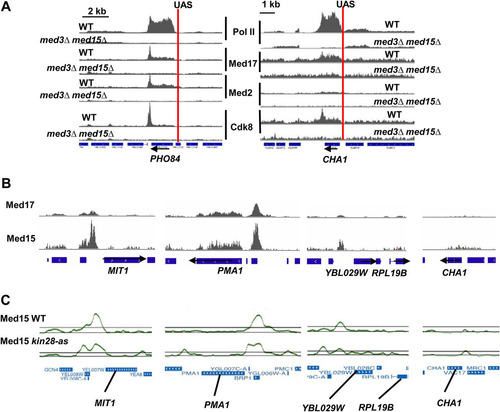
FIG 6 Variable Mediator occupancy at different UAS regions. (A) UAS regions of PHO84 and CHA1 show occupancy peaks for Med2 from the Mediator tail module that depend on the tail module triad and low occupancy for Pol II at these UASs. Screenshots from IGV for Med17 (head module), Med2 (tail module), and Pol II occupancy in wild-type and med3Δ med15Δ yeast, at the PHO84 and CHA1 loci and surrounding regions. Occupancy profiles are normalized between wild-type and mutant yeast but not between ChIP targets. The PHO5 and CHA1 UAS regions are indicated by the vertical red lines (Citation45, Citation46). (B) Occupancy profiles from IGV for Med17 and Med15 using data from reference Citation23. All profiles are set to the same scale. (C) Occupancy profiles from the UCSC Genome Browser for Med15 in wild-type yeast and under conditions of Kin28 inactivation, using data from reference Citation10; all profiles are set to the same scale.