Figures & data
FIG 1 Active Rap1 recruits ArhGAP29 to the plasma membrane. (A) The upper panel shows live imaging of confluent monolayers of HUVECs infected with a lentivirus transducing GFP-ArhGAP29. The cells were imaged prior to and 15 min after stimulation with 007-AM. The boxed areas of cell-cell contacts are enlarged in the insets. In the lower panel, a graph shows the relative intensity profiles of fluorescent signal intensities along the line scans depicted in the boxed area. (B) The upper panel shows live imaging of confluent monolayers of HUVECs infected with a lentivirus transducing GFP-ev. The cells were imaged prior to and 15 min after stimulation with 007-AM. The boxed areas of cell-cell contacts are enlarged in the insets. In the lower panel, a graph shows the relative intensity profiles of fluorescent signal intensities along the line scans depicted in the boxed area. (C) The left panel shows live imaging of GFP-ArhGAP29 expressing HUVECs, treated with control siRNA (siC) or siRNA targeting Rap1A and Rap1B (siRap1). The cells were grown to confluence and stimulated with 007-AM 15 min prior to imaging. The boxed areas are enlarged in insets. In the right panel, a graph shows the relative intensity profiles of fluorescent signal intensities along the line scans depicted in the boxed area. The knockdown efficiency was assessed by Western blotting. (D) Live imaging of confluent monolayers of HUVECs infected with a lentivirus transducing GFP-ArhGAP29. The cells were imaged prior to (left image) and 5 min after (right image) stimulation with prostacyclin. Enrichment of ArhGAP29 at cell-cell contacts is indicated by the arrow. (E) Live imaging of HEK293T cells transiently transfected with HA-Epac1, HA-Rap1A, V5-Radil, Flag-Rasip1, and YFP-ArhGAP29, imaged prior to and 10 min after stimulation with 007-AM. (F) Quantitative analysis of a representative ArhGAP29 translocation experiment in HEK293T cells (transfected as in panel E; see Movie S1 in the supplemental material). A custom-made analysis macro (ImageJ), which detects and measures signal in the plasma membrane (PM) and cytosol, respectively. (G) Imaging of YFP-ArhGAP29 in HEK293T cells transfected with V5-Radil, HA-Rasip1, or YFP-ArhGAP29 and with either CFP-ev, CFP-Rap1A(V12), or CFP-Rap1A(V12)ΔCAAX. Experiments were repeated at least three times, and representative images were chosen.
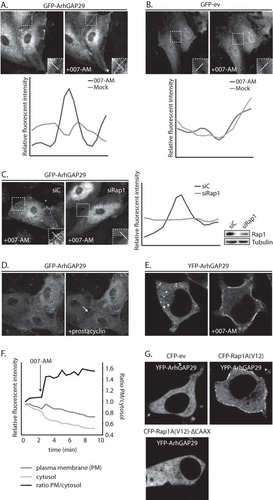
FIG 2 Active Rap1 recruits Radil and Rasip1 to the plasma membrane. (A) The left panel shows live imaging of confluent monolayers of HUVECs infected with a lentivirus transducing GFP-Radil and treated with control siRNA (siC) or siRNA targeting Rap1A and Rap1B (siRap1). The cells were imaged prior to or 15 min after stimulation with 007-AM. The boxed areas of cell-cell contacts are enlarged in the insets. In the right panel, a graph shows the relative intensity profiles of fluorescent signal intensities along the line scans depicted in the boxed area. The knockdown efficiency was assessed by Western blotting. (B) The left panel shows live imaging of confluent monolayers of HUVECs infected with a lentivirus transducing GFP-Rasip1 and treated with control siRNA (siC) or siRNA targeting Rap1A and Rap1B (siRap1). The cells were imaged prior to or 15 min after stimulation with 007-AM. The boxed areas of cell-cell contacts are enlarged in the insets. In the right panel, a graph shows the relative intensity profiles of fluorescent signal intensities along the line scans depicted in the boxed area. Knockdown efficient was assessed by Western blotting. (C) Still images (taken prior to and 3 min after 007-AM stimulation) corresponding to the live imaging (see Movie S2 in the supplemental material) of HEK293T cells transiently transfected with HA-Epac1, HA-Rap1A, mCherry-Radil, HA-Rasip1, and HA-ArhGAP29. (D) Quantitative plasma membrane (PM)/cytosol analysis (as in ) of mCherry-Radil translocation in Movie 2 in the supplemental material. (E) Still images (taken prior to and 2 min after 007-AM stimulation) corresponding to the live imaging (see Movie S3 in the supplemental material) of HEK293T cells transiently transfected with HA-Epac1, HA-Rap1A, V5-Radil, YFP-Rasip1, and HA-ArhGAP29. (F) Quantitative plasma membrane (PM)/cytosol analysis (as in ) of the YFP-Rasip1 translocation shown in Movie S3 in the supplemental material. (G) Live imaging of mCherry-Radil in HEK293T cells transfected with mCherry-Radil, HA-Rasip1, and HA-ArhGAP29 and with either CFP-ev, CFP-Rap1A(V12) or CFP-Rap1A(V12)ΔCAAX. (H) Live imaging of YFP-Rasip1 in HEK293T cells transfected with YFP-Rasip1, V5-Radil, and HA-ArhGAP29 and with either CFP-ev, CFP-Rap1A(V12), or CFP-Rap1A(V12)ΔCAAX. (I) Alignment of the RA domains of Radil, Rasip1, and the second RA domain of AF6. Highlighted with gray is the conserved lysine, which is essential for interaction with GTP-loaded Rap1. (J) Live imaging of wild-type versus RA mutant mCherry-Radil (upper panels) and wild-type versus RA mutant YFP-Rasip1 (lower panels) in HEK293T cells transfected with HA-Rasip1, V5-Radil, HA-ArhGAP29, and HA-Rap1A(V12), together with mCherry-Radil, mCherry-Radil K79A, YFP-Rasip1, or YFP-Rasip1 K163A. The experiments were repeated at least three times; representative images are shown.
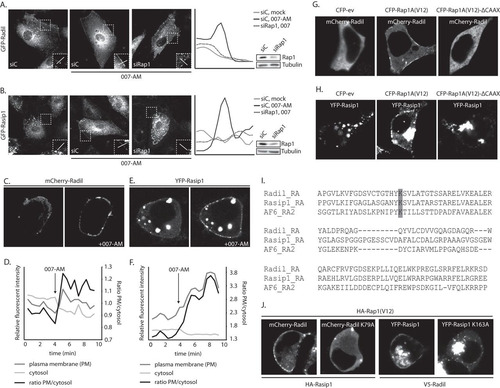
FIG 3 Rasip1 and Radil translocate to the plasma membrane independently. (A) The upper panel shows live imaging of GFP-Radil-expressing HUVECs, treated with control siRNA (siC), or siRNA targeting Rasip1 (siRasip1). Cells were grown to confluence and stimulated with 007-AM 15 min prior to imaging. Boxed areas are enlarged in insets. In the lower panel, the left graph shows the relative intensity profiles of fluorescent signal intensities along the line scans depicted in the boxed area. The right graph shows the knockdown efficiency as assessed by Q-PCR. (B) The upper panel shows live imaging of GFP-Rasip1-expressing HUVECs, treated with control siRNA (siC) or siRNA targeting Radil (siRadil). The cells were grown to confluence and stimulated with 007-AM for 15 min prior to imaging. The boxed areas are enlarged in insets. In the lower panel, the left graph shows the relative intensity profiles of fluorescent signal intensities along the line scans depicted in the boxed area. The right graph shows the knockdown efficiency as assessed by Q-PCR. (C) Live imaging of mCherry-Radil or YFP-Rasip1 in HEK293T cells transfected with HA-Rap1A(V12) and both mCherry-Radil and YFP-Rasip1 (upper panels), only mCherry-Radil (lower left panel), or only YFP-Rasip1 (lower right panel). (D) Live imaging of wild or mutant mCherry-Radil (as indicated) in HEK293T cells transfected with HA-Rap1A(V12) and either mCherry-Radil or mCherry-Radil K79A, together with either HA-Rasip1 or HA-Rasip1 K163A. (E) Live imaging of wild or mutant YFP-Rasip1 (as indicated) in HEK293T cells transfected with HA-Rap1A(V12) and either YFP-Rasip1 or YFP-Rasip1 K163A, together with either V5-Radil or V5-Radil K79A.
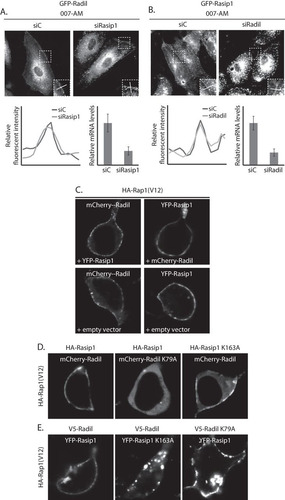
FIG 4 Rap1 recruits ArhGAP29 to the plasma membrane through Radil. (A) In the upper panel, GFP-ArhGAP29 expressing HUVECs were treated with control siRNA (siC), siRNA targeting Radil and Rasip1 (siRadil + siRasip1), and Radil (siRadil) or Rasip1 (siRasip1). The cells were grown to confluence and treated with 007-AM for 15 min. The boxed areas of cell-cell contacts are enlarged in the insets. In the lower panel, the left graph shows the relative intensity profiles of fluorescent signal intensities along the line scans depicted in the boxed area. The right graph shows the knockdown efficiency as assessed by Q-PCR. (B) Live imaging of YFP-ArhGAP29 in HEK293T cells transfected with HA-Rap1A(V12) and YFP-ArhGAP29 upon cotransfection with either V5-Radil and HA-Rasip1 (first panel), empty vector only (second panel), HA-Rasip1 supplemented with empty vector (third panel), or V5-Radil supplemented with empty vector (fourth panel). (C) Live imaging of YFP-ArhGAP29 in HEK293T cells transfected with HA-Rap1A(V12) and YFP-ArhGAP29 upon cotransfection with either V5-Radil and HA-Rasip1 (first panel), V5-Radil K79A (V5-Radil KA) and HA-Rasip1 (second panel), or V5-Radil and HA-Rasip1 K163A (HA-Rasip1 KA) (third panel). The experiments were repeated at least three times, and representative images were chosen.
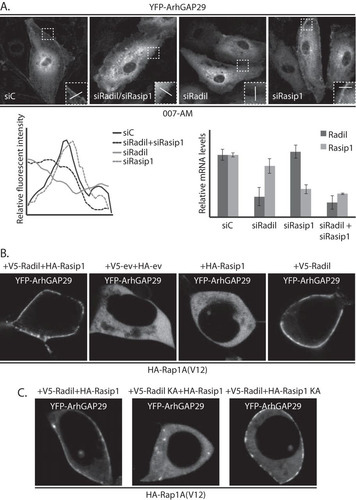
FIG 5 ArhGAP29 binds the PDZ-domain of Radil through its C terminus. (A) Domain architecture of Radil and the truncation mutants used for the assays depicted in panels B and C. RA, Ras association domain; DIL, dilute domain; PDZ, PSD-95/Dlg1/ZO-1. (B) Coimmunoprecipitation of V5-Radil truncation mutants with HA-ArhGAP29 expressed in HEK293T cells. The Western blot is representative of three independent experiments. (C) Live imaging of YFP-ArhGAP29 in HEK293T cells transfected with YFP-ArhGAP29 and HA-Rap1A(V12) in the presence of V5-Radil or V5-RadilΔPDZ. Experiments were repeated four times, and representative images were chosen. (D) Coimmunoprecipitation of V5-Radil with YFP-tagged full-length ArhGAP29 or ArhGAP29 lacking its last four amino acids (ArhGAP29ΔC) expressed in HEK293T. The Western blot is representative of two independent experiments. (E) Live imaging of YFP-ArhGAP29 in HEK293T cells transfected with YFP-ArhGAP29 or YFP-ArhGAP29ΔC with HA-Rap1A(V12) and V5-Radil. The experiments were repeated four times, and a representative image was chosen.
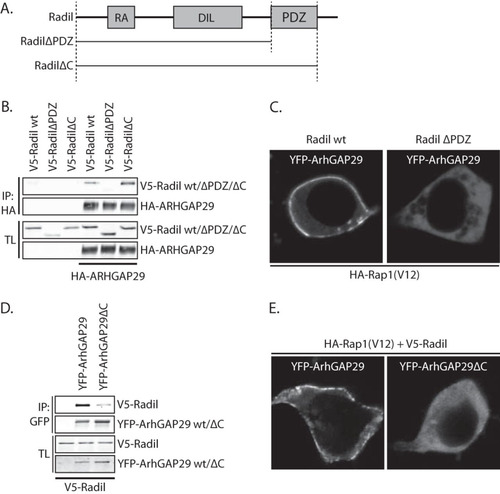
FIG 6 Rasip1 forms a multimeric complex with ArhGAP29 and Radil. (A) Coimmunoprecipitation of Flag-Rasip1 with YFP-ArhGAP29 (detected using an anti-GFP antibody) in the presence or absence of V5-Radil in HEK293T cells. The experiments were repeated at least four times. (B) Coimmunoprecipitation of Flag-Rasip1 and V5-Radil with YFP-ArhGAP29 (detected with an anti-GFP antibody) in the presence or absence of HA-Rap1A(V12) in HEK293T cells.
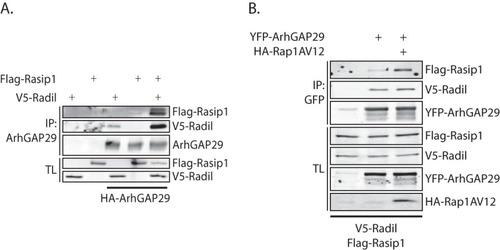
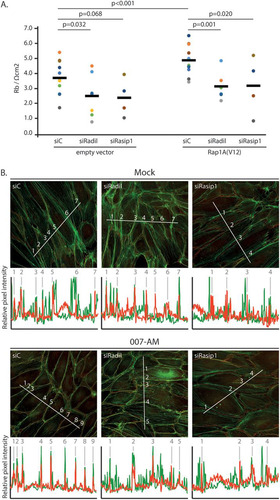
FIG 7 Rasip1 and Radil are required for Rap1-induced endothelial barrier function. (A) Endothelial barrier (Rb) of control HUVEC monolayers (siC) and HUVEC monolayers depleted of Radil (siRadil) or Rasip1 (siRasip1), transduced with control lentivirus or Rap1A(V12) containing lentivirus. Different colors represent independent experiments (n > 4). Averages are indicated by the black line. (For the knockdown efficiencies, see Fig. S1A and B in the supplemental material.) (B) Immunofluorescence of HUVECs transfected with control siRNA (siC), siRNA targeting Radil (siRadil), or siRNA targeting Rasip1 (siRasip1). Cells were grown to confluence and either not stimulated or stimulated with 007-AM 15 min prior to fixation. The cells were stained for β-catenin (red) and F-actin (phalloidin, green). The graphs show the relative intensity profiles of fluorescent signal intensities of phalloidin (green) and β-catenin (red) along the line scans depicted in the immunofluorescent images. Gray lines and numbers correlate to where the line scan crosses an adherens junction, as assessed by β-catenin staining. (For the knockdown efficiencies, see Fig. S1C in the supplemental material.)