Figures & data
FIG 1 Cyclin ET74A T393A HSCs are defective for multilineage reconstitution but not long-term self-renewal. (A) Left, bone marrow cells from wild-type or cyclin ET74A T393A mice were enriched for HSPCs by immunomagnetic separation based on lineage-negative CD150+ surface marker expression. Western blot analyses of cyclin E abundance are shown. Right, transcript abundances of Ccne1 in primary bone marrow HSPCs were compared using quantitative RT-PCR. Error bars indicate standard deviations with two biological replicates. (B) Left, bone marrow cells from poly(I) · poly(C)-treated Mx1-cre− Fbxw7fl/fl and Mx1-cre+ Fbxw7fl/fl mice were harvested for Western blot analyses. Cyclin E protein abundances in bone marrow extracts were analyzed using affinity-purified anti-cyclin E antibody, with anti-Grb2 antibody as the loading control. Loss of the floxed band in bone marrow and excision of the deleted allele were confirmed by PCR. Right, E14.5 fetal liver cells from wild-type, Fbxw7fl/+, or Fbxw7fl/fl mice were lineage depleted, followed by transduction with Cre recombinase. Immunoblot analyses of cyclin E abundance in Cre-expressing fetal liver extracts are shown. (C) Schematic of serial adoptive transfer assays is shown. Donor (CD45.2) HSCs of the indicated genotypes were isolated based on criteria listed in and transplanted into irradiated (11 Gy) CD45.1 recipients, along with Lin+ Sca1− CD45.1 cells for short-term hematopoietic support. Recipient mice were monitored for 3 months, after which unfractionated bone marrow cells were prepared from primary recipients and injected into irradiated wild-type mice. This process was reiterated after 3 months. Symbols (1°, 2°, 3°) denote primary, secondary, and tertiary transplants, respectively. (D and E) Peripheral blood and total bone marrow cell donor chimerisms were calculated as shown in y axes at 3 months after each round of transplantation (n = 9 to 14 recipients per group). (F and G) Lineage-specific donor chimerism and bone marrow composition of donor-derived cells following secondary transplantation are shown. (H) Absolute numbers of donor-derived HSCs were enumerated in individual recipient mice 3 months after each round of transplantation. (D to G) Error bars display standard errors. *, P < 0.05; **, P < 0.005; ***, P < 0.0001, using Student's t test.
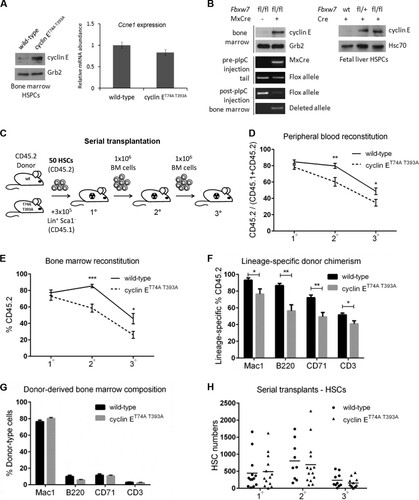
TABLE 1 Characterization of hematopoietic stem and progenitor cellsTable Footnotea
FIG 2 Cyclin ET74A T393A hematopoietic stem and progenitor cells show proliferative defects in response to hematologic stress. (A) Absolute numbers of HSCs in wild-type and cyclin ET74A T393A mice were enumerated at steady state. Inset, steady-state HSC cell cycle distributions were determined using intracellular Ki67 and Hoechst 33342 staining. (B) Assay of BrdU label-retaining cells was performed as previously described (Citation1). Percentage of BrdU+ HSCs after 10 days of labeling in vivo and percentage of BrdU label-retaining HSCs after 70 days of chase are shown. Shown are means ± standard errors of the means of results for three mice per time point. (C and D) HSC numbers and cell cycle distributions (insets) were determined 10 days and 21 days after 5FU treatment. (E and F) Absolute numbers of the indicated multipotent progenitor cell populations (MPP1- to -3) in wild-type and cyclin ET74A T393A mice were enumerated at steady state and 21 days following 5FU treatment. *, P < 0.05; **, P < 0.02, using Student's t test.
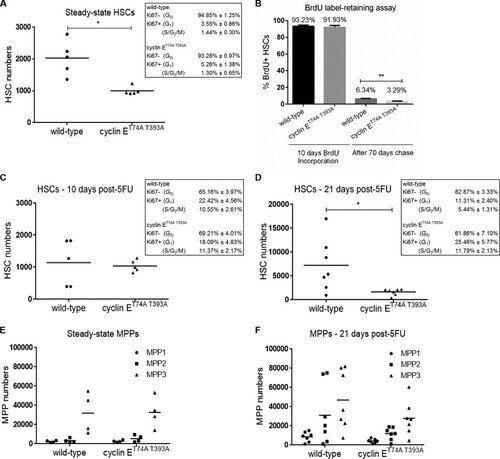
FIG 3 Cyclin E deregulation induces chromosomal instability in HSPCs after hematologic stress. (A) Wild-type (CD45.1) recipients were transplanted with 1 × 10⁶ (CD45.2) bone marrow cells isolated from wild-type or cyclin ET74A T393A mice. Three months after engraftment, recipients of bone marrow cells of the indicated genotypes were either injected with a single dose of 5FU or remained untreated, and absolute numbers of donor-derived HSCs were enumerated at 10 days or 21 days later. *, P < 0.05; **, P < 0.0005, using Student's t test. (B) Cohorts of mice transplanted with bone marrow cells of the indicated genotypes were established, and 3 months after engraftment, recipient mice with equivalent peripheral blood donor chimerism (>85%) were treated with 5FU (150 mg/kg) every 10 days (stars). The survival of the groups was analyzed using the Gehan-Breslow-Wilcoxon test (P = 0.0172) and expressed as Kaplan-Meier survival curves (n = 13). (C) Three months after engraftment, recipients of bone marrow cells of the indicated genotypes were either injected with a single dose of 5FU or left untreated. The cohort was then labeled with bromodeoxyuridine (BrdU) for 7 days. At the end of the in vivo labeling period, HSCs were analyzed for BrdU incorporation. Error bars display standard errors. (D) Top, HSPCs of the indicated genotypes were isolated from wild-type recipients 17 days after 5FU exposure, briefly cultured, and arrested in metaphase with Colcemid. Chromosomes were examined using a confocal microscope, and the results of enumerating chromosomes for 50 metaphase cells are shown. The chi-square test was used to determine statistical significance for the difference in metaphase chromosome count distribution (<40, 40, or >40) between wild-type and cyclin ET74A T393A HSPCs. Fisher's exact test was used to determine the statistical significance for the difference in normal and abnormal chromosome counts between wild-type and cyclin ET74A T393A cells. *, P < 0.02. Bottom, representative confocal images of metaphase chromosomes are shown (100× magnification). (E) Enumeration of metaphase chromosomes from untreated, wild-type, and cyclin ET74A T393A HSPCs is shown. n.s., not significant, using Fisher's exact test.
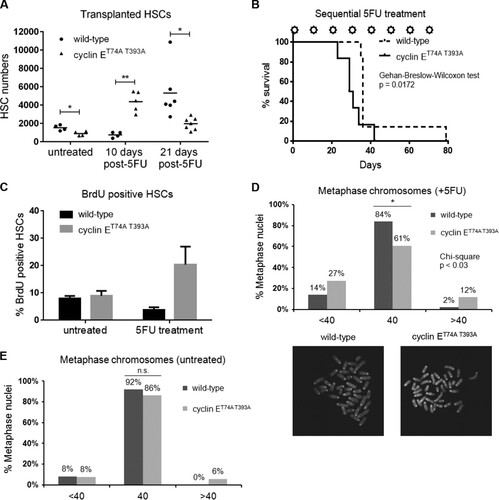
FIG 4 Loss of the p53 pathway reveals self-renewal defects in cyclin ET74A T393A HSCs. (A) Quantitative RT-PCR analyses of the indicated p53 gene targets in wild-type and cyclin ET74A T393A HSCs are shown. Each bar represents the average value from triplicate quantitative RT-PCR assays from one cyclin ET74A T393A mouse, expressed as log(fold difference) compared to the results for an age- and sex-matched wild-type control. (B) Peripheral blood cell donor chimerism was calculated as shown in the y axis at 3 months after each round of transplantation (n = 7 or 8 wild-type recipients per group) for recipients of p53-null HSCs of the indicated cyclin E genotypes. (C and D) Total bone marrow donor chimerism and lineage-specific donor chimerism were determined 3 months after engraftment. (E) Bone marrow compositions of donor-derived cells of the indicated genotypes following secondary transplantation are shown. (F) Absolute numbers of donor-derived HSCs were enumerated in individual recipient mice 3 months after each round of transplantation. (G) Serial adoptive transfer assays were performed using cyclin Ewt; p21−/− or cyclin ET74A T393A; p21−/− HSCs as donor cells. Absolute numbers of donor-derived HSCs in individual recipient mice following primary and secondary transplantation are shown. Error bars display standard errors. *, P < 0.05; **, P < 0.005; ***, P < 0.001; ****, P < 0.0001, using Student's t test.
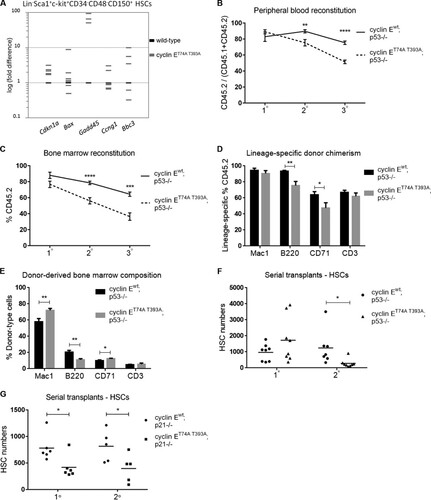
FIG 5 Ablation of the p53 pathway unmasks chromosome instability in cyclin ET74A T393A HSPCs. (A and B) Enumeration of metaphase chromosomes from HSPCs of the indicated genotypes was performed as described in the legend to . *, P < 0.04; **, P < 0.01, using Fisher's exact test. (C) Results of centrosome enumeration in cyclin Ewt; p53−/− and cyclin ET74A T393A; p53−/− HSPCs using γ-tubulin and DAPI costaining are shown. (D) BrdU incorporation of cyclin Ewt; p53−/− and cyclin ET74A T393A; p53−/− HSCs was determined as described in the legend to . Error bars indicate standard deviation with biological replicates (n = 3 per genotype).
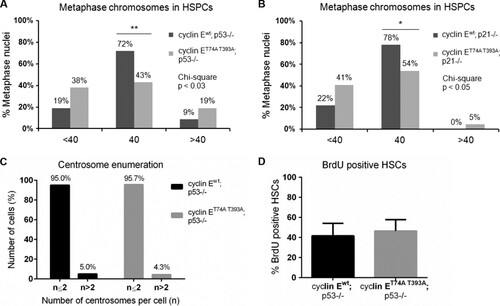
FIG 6 Recipients of cyclin ET74A T393A; p53−/− HSCs develop T-cell malignancies in a background of erythroid hyperplasia and dysplasia. (A) Representative 40× micrographs of Wright-Giemsa-stained bone marrow cytospins from wild-type recipients of cyclin Ewt; p53−/− and cyclin ET74A T393A; p53−/− bone marrow cells are shown. Myeloid-to-erythroid ratios were calculated by scoring 400 to 700 nucleated cells per genotype based on morphology. (B) Left, absolute numbers of bone marrow B-lymphocytes from recipients of cyclin Ewt; p53−/− and cyclin ET74A T393A; p53−/− HSCs (n = 14) are shown, demonstrating reduced donor-type cyclin ET74A T393A immature B cells (B220low IgM+) and recirculating/mature B cells (B220high IgM+). Right, donor-type B220+ cells from recipient mice (n = 9) were assessed for apoptosis using annexin V and 7-AAD staining. Error bars display standard errors. *, P < 0.05; **, P < 0.00001, using Student's t test. (C) Bone marrow cells from wild-type or cyclin ET74A T393A mice were enriched for B220+ B cells by immunomagnetic separation. Western blot analyses of cyclin E abundance are shown. (D) Survival curves of wild-type recipients of cyclin Ewt; p53−/− and cyclin ET74A T393A; p53−/− HSCs after tertiary transplantation are shown for the cohort subset (n = 9 out of 14 recipients) with comparable donor-type bone marrow chimerism (>60%). Survival data were analyzed using the Gehan-Breslow-Wilcoxon test (P = 0.0150) and expressed as Kaplan-Meier survival curves. (E) Representative donor-type thymocyte immunophenotyping from cyclin Ewt; p53−/− and cyclin ET74A T393A; p53−/− tertiary transplant recipients. (F) Representative flow cytometry plots displaying donor-type bone marrow CD3 expression versus side scatter (SSC) are shown for tertiary transplant recipients (top). Representative hematoxylin and eosin stains of formalin-fixed, paraffin-embedded bone marrows (middle; 40× magnification) and Wright-Giemsa-stained peripheral blood smears (bottom; 100× magnification) from recipients of cyclin Ewt; p53−/− and cyclin ET74A T393A; p53−/− HSCs analyzed as described for panel D are shown.

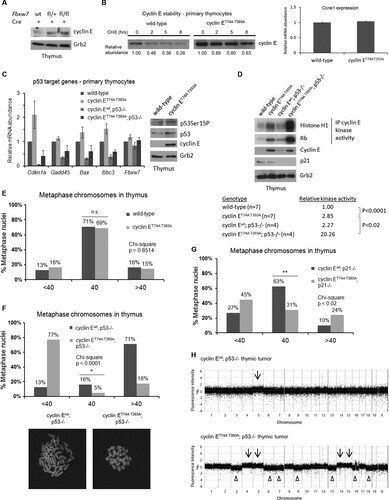
FIG 7 Deregulated cyclin E activity cooperates with p53 loss to promote chromosomally unstable T-cell neoplasms. (A) Primary thymocytes from wild-type, Fbxw7fl/+, or Fbxw7fl/fl mice were transduced with Cre recombinase to generate conditional Fbxw7 knockout allele. Western blot analyses of cyclin E abundance in Cre-expressing thymocyte extracts are shown. (B) Primary thymocytes from wild-type and cyclin ET74A T393A mice were cocultured with OP9/DL stromal cells overnight and then treated with 25 μg/ml of cycloheximide for the indicated times. Left, cyclin E immunoblots are shown with relative abundances, quantified using ImageJ. Right, abundances of Ccne1 mRNA in primary thymocytes were compared using quantitative RT-PCR. (C) Left, quantitative RT-PCR analysis of the indicated p53 target genes in primary thymocytes isolated from mice of the indicated genotypes is shown, with expression values normalized to relative expression in wild-type controls. Right, immunoblot analyses of p53 serine 15 phosphorylation, total p53, and cyclin E abundance in thymocyte extracts from wild-type and cyclin ET74A T393A mice are shown. Grb2 immunoblot is shown as loading control. (D) Top, total lysates were prepared from primary thymocytes of the indicated genotypes and immunoblotted to detect endogenous cyclin E and p21. Histone H1 and Rb were used to measure endogenous cyclin E kinase activities from immunoprecipitated (IP) cyclin E complexes. Grb2 immunoblot is shown as loading control. Bottom, kinase activities were quantified and normalized to activity measured in the wild-type samples. Student's t test was used to determine the statistical significance for the difference in cyclin E kinase activities. (E) Enumeration of metaphase chromosomes from wild-type and cyclin ET74A T393A thymocytes is shown. (F and G) Enumeration of metaphase chromosomes from thymocytes of the indicated genotypes is shown. (F) Bottom, representative confocal images of metaphase chromosomes from thymocytes of the indicated genotypes. (H) Array CGH results for representative thymic tumors obtained from recipients of cyclin Ewt; p53−/− and cyclin ET74A T393A; p53−/− HSCs are shown. Fluorescence intensities in thymic tumors were normalized to genomic DNA from wild-type thymocytes and are expressed as log2 ratios. Chromosome identification is shown on the x axis. Arrows indicate gains and arrowheads indicate losses of chromosomes. Error bars indicate standard deviations with two biological replicates. n.s., not significant; *, P < 0.04; **, P < 0.01, using Fisher's exact test.