Figures & data
Fig 1 Satb1 levels are much higher in discrete regions in postnatal mouse brain than Satb2 levels. Immunostaining of P13 wild-type brain coronal sections with Satb1-specific (A) or Satb2-specific (B) antibodies counterstained with DAPI is shown. The boxed area of the hippocampus in panels A and B is magnified for Satb1 and Satb2 at the right. Representative images of nuclear localization of Satb1 in wild-type brain are shown (C, basolateral amygdala neuron). RNA FISH of P13 wild-type coronal sections with Satb1-specific (green in panel D) and Satb2-specific (red in panel D) antisense riboprobes and a merged image of these stainings (D) is shown. The boxed area in panel D (cerebral cortex) is magnified at the right, indicating that Satb1 and Satb2 have a distinct distribution in the cortex. Satb1 is specific in the amygdala, as indicated with arrows (A and B [for IF] or D [for FISH]). Scale bar, 500 μm (A, B, and D) or 5 μm (C). (E) Satb1 and Satb2 cortical protein levels in wild-type mice were determined at different ages by Western blotting using anti-Satb1 mouse monoclonal antibody (a) (BD Biosciences; reacts with both Satb1 and Satb2 proteins), purified anti-Satb1 rabbit polyclonal antibody (b) (Satb1-specific), or anti-Satb2 polyclonal antibody (c) (Satb2 specific) (see Materials and Methods). Anti-tubulin-α antibody was used for loading control measurement. (F) Relative transcript levels of Satb1 and Satb2 in cortex at different ages (1 day [1d] to 5 weeks [5w]) were measured by qPCR (RT2 qPCR primers; SABiosciences). The value for each time point represents the average for three replicates. These data indicate that Satb1 is the major component of the Satb family in the postnatal cerebral cortex.
![Fig 1 Satb1 levels are much higher in discrete regions in postnatal mouse brain than Satb2 levels. Immunostaining of P13 wild-type brain coronal sections with Satb1-specific (A) or Satb2-specific (B) antibodies counterstained with DAPI is shown. The boxed area of the hippocampus in panels A and B is magnified for Satb1 and Satb2 at the right. Representative images of nuclear localization of Satb1 in wild-type brain are shown (C, basolateral amygdala neuron). RNA FISH of P13 wild-type coronal sections with Satb1-specific (green in panel D) and Satb2-specific (red in panel D) antisense riboprobes and a merged image of these stainings (D) is shown. The boxed area in panel D (cerebral cortex) is magnified at the right, indicating that Satb1 and Satb2 have a distinct distribution in the cortex. Satb1 is specific in the amygdala, as indicated with arrows (A and B [for IF] or D [for FISH]). Scale bar, 500 μm (A, B, and D) or 5 μm (C). (E) Satb1 and Satb2 cortical protein levels in wild-type mice were determined at different ages by Western blotting using anti-Satb1 mouse monoclonal antibody (a) (BD Biosciences; reacts with both Satb1 and Satb2 proteins), purified anti-Satb1 rabbit polyclonal antibody (b) (Satb1-specific), or anti-Satb2 polyclonal antibody (c) (Satb2 specific) (see Materials and Methods). Anti-tubulin-α antibody was used for loading control measurement. (F) Relative transcript levels of Satb1 and Satb2 in cortex at different ages (1 day [1d] to 5 weeks [5w]) were measured by qPCR (RT2 qPCR primers; SABiosciences). The value for each time point represents the average for three replicates. These data indicate that Satb1 is the major component of the Satb family in the postnatal cerebral cortex.](/cms/asset/145c3c70-099b-4610-80ed-af2f75777446/tmcb_a_12273696_f0001_oc.jpg)
Fig 2 Satb1 depletion results in no alteration in gross morphological development but significant alteration of IEG expression in the cerebral cortex. (A) Mouse coronal sections prepared from Satb1-null and wild-type littermates were immunostained with antibodies for Satb1 and its homolog Satb2 (in red), as well as Tbr1 for layer 6 and Ctip2 for layer 5/6 (in green). There is no difference in layer-specific markers and cortical thickness between wild-type and Satb1-null mice. Scale bar, 100 μm. (B) Relative levels of transcripts of Satb1, Satb2, Ctip2, Tbr1, Fezf2 (gene regulator for Ctip2), and Foxp2 (layer 6 marker) (top row), as well as IEGs (Fos, Fosb, Egr1, Egr2, Arc, and Bdnf) (bottom row), in the cerebral cortex of wild-type and Satb1-null mice (13 days old) were analyzed by qPCR. Layer-specific modulator genes were not altered in Satb1-null mice (red bar) compared with those in wild-type mice (blue bar). However, all IEGs tested were significantly altered in Satb1-null mice. Values represent mean values ± SE; ∗, P ≤ 0.05 (for the wild type, n = 4; for Satb1 null, n = 4). (C) The temporal and relative levels of gene expression during postnatal cortical development for layer-specific modulators (Ctip2, Tbr1, Fezf2, and FoxP2) and IEGs (Fos, Fosb, Egr1, Egr2, Arc, and Bdnf) were analyzed in wild-type mice (between 7 days and 56 days; blue line with circles) and Satb1-null mice (between 7 days and 13 days; red line with squares). Levels of gene expression of layer-specific modulators showed no difference between wild-type mice and Satb1-null mice (top row). On the other hand, Satb1-null mice showed significant alteration in temporal and expression levels of IEGs (bottom row). Day 21, shown in red, is the maximum time of Satb1-null mouse survival. ∗, P < 0.01 (n = 3 or 4 at each time point).
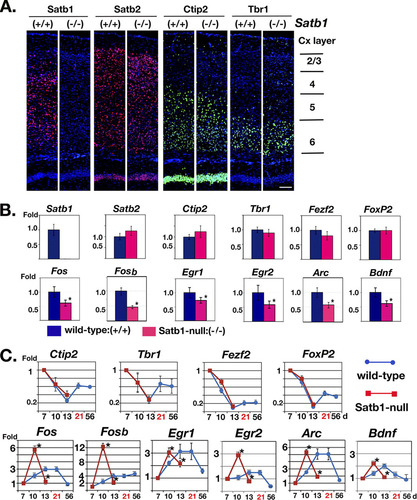
Table 1 Altered levels of gene expression in cyclic AMP-, serum-, or Ca2+-dependent genes other than IEGs in Satb1-null mouse brain relative to that in wild-type miceTable Footnotea
Fig 3 Satb1 is required for multiple neuronal genes in response to forskolin stimulation in vitro. Organotypic cortical explant cultures prepared from Satb1-null or wild-type brains were treated with 25 μM forskolin (FK) for 1 h, 2 h, and 4 h or from 0.1% DMSO-treated samples as a control (0 h). qPCR was used to determine the expression levels of SRE/CRE/CaRE- containing genes in cultures. Fold induction of gene expression at different time points relative to induction at 0 h was calculated. Representative genes with significantly different fold inductions in Satb1-null brain samples (red) compared to wild-type brain samples (blue) are presented (IEGs [A] or non-IEGs [B]). The data for Penk1, Thbs1, Pmaip1, and Calb1 are not shown. However, the responses of Penk1 and Thbs1 to FK are similar to that of Sst. Pmaip1 is similar to Arc. Calb1 is similar to Calb2. Each data point represents the mean value ± SE for four experimental replicates. ∗, P ≤ 0.05.
![Fig 3 Satb1 is required for multiple neuronal genes in response to forskolin stimulation in vitro. Organotypic cortical explant cultures prepared from Satb1-null or wild-type brains were treated with 25 μM forskolin (FK) for 1 h, 2 h, and 4 h or from 0.1% DMSO-treated samples as a control (0 h). qPCR was used to determine the expression levels of SRE/CRE/CaRE- containing genes in cultures. Fold induction of gene expression at different time points relative to induction at 0 h was calculated. Representative genes with significantly different fold inductions in Satb1-null brain samples (red) compared to wild-type brain samples (blue) are presented (IEGs [A] or non-IEGs [B]). The data for Penk1, Thbs1, Pmaip1, and Calb1 are not shown. However, the responses of Penk1 and Thbs1 to FK are similar to that of Sst. Pmaip1 is similar to Arc. Calb1 is similar to Calb2. Each data point represents the mean value ± SE for four experimental replicates. ∗, P ≤ 0.05.](/cms/asset/1861b46a-e236-4094-a26c-9b20a43069f9/tmcb_a_12273696_f0003_oc.jpg)
Fig 4 Satb1 binds IEGs and other neuronal genes in vivo. Urea-chromatin immunoprecipitation (Urea-ChIP) was carried out with either anti-Satb1 antibody or preimmune serum. qPCR was used to determine relative fold enrichment of 5 or 6 different genomic sites in anti-Satb1 ChIP samples for each gene (an indication of Satb1 binding). Potential Satb1-binding loci (containing ATC sequences) are marked by numbers in red under the genomic sequence, and potential non-Satb1-binding loci are marked by numbers in black as controls. Red stars label significant fold enrichment relative to that for the internal control site determined by this assay, indicating Satb1 was bound to these sites. Exons for each genomic sequence are marked by green boxes, and translation initiation sites are marked by black arrows. As expected for Satb1-independent genes in the brain, all potential Satb1 binding sites for such genes (C) (Hbb-b1 and Hprt1) were not bound by Satb1, indicating that the gene is either not expressed (Hbb-b1) or not Satb1 dependent (Hprt1) in the cerebral cortex.
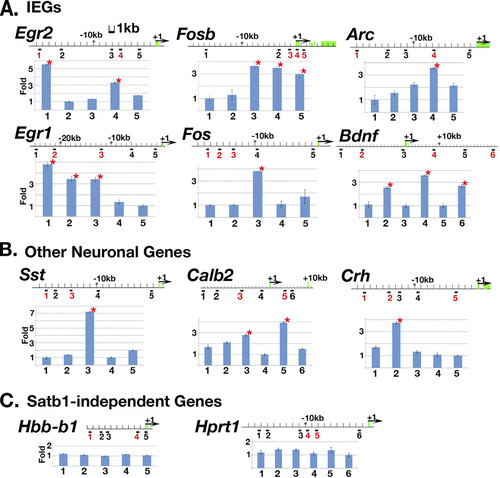
Fig 5 Dendritic spine density in cortical pyramidal neurons is reduced in Satb1-null mice. To determine whether Satb1-expressing neurons are excitatory or inhibitory cells in the cerebral cortex, Gad67 (A and B) for inhibitory and vGlut2 (C) for excitatory markers were used for double immunostaining. In layers 4/5 in the cortex, Gad67-positive cells (9% of DAPI+ cells) were almost all Satb1-positive cells (A and B), and 60% of Satb1-positive cells (51% of DAPI+ cells) were also vGlut2 positive (C). Scale bar, 225 μm (A), 50 μm (B), or 150 μm (C). (D) Representative images of Golgi-Cox-stained morphology in the cerebral cortex (Cx) in wild-type and Satb1-null mice. Dendrite complexity is not significantly altered between wild-type and Satb1-null neurons (Sholl analysis; data not shown). Scale bar, 1,000, 500, or 50 μm (left to right, respectively). (E) Representative images of Golgi-stained dendrites from cerebral cortex-pyramidal cells (Cx-Py, M1 region) in wild-type and Satb1-null mice. A clear reduction in spine number is observed in Satb1-null mice. Scale bar, 10 μm. (F) Dendritic spine density in two distinct cortical regions (M1 [a] and AuV [b]) is reduced ∼50% in Satb1-null mice but not in the hippocampus (Hip-Py). The hippocampal pyramidal cells have undetectable level of Satb1 expression in wild-type mice and show no difference in dendritic spine density between wild-type and Satb1-null mice. n = 4 mice × 4 cells for each region (total, 16 neurons/site). ∗, P ≤ 0.01.
![Fig 5 Dendritic spine density in cortical pyramidal neurons is reduced in Satb1-null mice. To determine whether Satb1-expressing neurons are excitatory or inhibitory cells in the cerebral cortex, Gad67 (A and B) for inhibitory and vGlut2 (C) for excitatory markers were used for double immunostaining. In layers 4/5 in the cortex, Gad67-positive cells (9% of DAPI+ cells) were almost all Satb1-positive cells (A and B), and 60% of Satb1-positive cells (51% of DAPI+ cells) were also vGlut2 positive (C). Scale bar, 225 μm (A), 50 μm (B), or 150 μm (C). (D) Representative images of Golgi-Cox-stained morphology in the cerebral cortex (Cx) in wild-type and Satb1-null mice. Dendrite complexity is not significantly altered between wild-type and Satb1-null neurons (Sholl analysis; data not shown). Scale bar, 1,000, 500, or 50 μm (left to right, respectively). (E) Representative images of Golgi-stained dendrites from cerebral cortex-pyramidal cells (Cx-Py, M1 region) in wild-type and Satb1-null mice. A clear reduction in spine number is observed in Satb1-null mice. Scale bar, 10 μm. (F) Dendritic spine density in two distinct cortical regions (M1 [a] and AuV [b]) is reduced ∼50% in Satb1-null mice but not in the hippocampus (Hip-Py). The hippocampal pyramidal cells have undetectable level of Satb1 expression in wild-type mice and show no difference in dendritic spine density between wild-type and Satb1-null mice. n = 4 mice × 4 cells for each region (total, 16 neurons/site). ∗, P ≤ 0.01.](/cms/asset/eacb906d-5e07-4ea4-a33b-1f61164e379f/tmcb_a_12273696_f0005_oc.jpg)
Table 2 Satb1-dependent genes selected from 82 SRE/CRE/CaRE genes tested