Figures & data
FIG 1 The TTP CIM promotes mRNA deadenylation and decay. (A) Schematic of mouse TTP, highlighting conserved tryptophan residues (W) interacting with CNOT9, tetraproline motifs (PPPP) interacting with the 4EHP-GYF2 translation repression complex, and the CNOT1-interacting motif (CIM), shown in purple. NTD: N-terminal domain, ZFD: Zinc-Finger Domain, CTD: C-terminal domain. (B) Schematic of the tethered mRNA decay assay. A tetracycline-regulated β-globin mRNA containing MS2 coat protein (MS2cp) stem-loop binding sites in the 3’UTR is targeted by MS2-TTP fusion proteins. (C) Representative Northern blots monitoring the degradation in HeLa Tet-off cells over time after transcriptional shutoff by addition of tetracycline, of β-globin mRNA (Target) tethered to MS2-GFP (left) or MS2-GFP-CIM (right) fusion proteins compared to an extended β-globin mRNA (Control) that lacks MS2-coat protein binding sites and is not regulated by tetracycline. The half-life of the target mRNA calculated after normalization to the internal control is shown below each panel with standard deviation from four independent experiments. (D) Graph quantifying mRNA decay assays for β-globin mRNA tethered to MS2-GFP fusion proteins shown in panel C. Dots represent target mRNA abundance relative to the internal control at each time point with standard deviations shown from four independent replicates (n = 4). The curves represent best fits to first-order degradation. Calculated half-lives are given with standard deviation. (E) Western blots monitoring expression levels of indicated FLAG-MS2-GFP fusion proteins in the experiment in panel C. GAPDH serves as an internal control. (F) Graph showing relative band mobilities as a measure of mRNA deadenylation from the experiment in panel C. Dots represent mobility of the target mRNA relative to the control mRNA, with the mobility at time zero set to 100 and the mobility of a deadenylated target mRNA, generated by treatment with oligo-dT and RNase H (panel G), set as 0. Error bars represent standard deviation (n = 4). (G) Northern blot monitoring β-globin mRNA tethered to MS2-GFP-CIM fusion protein in HeLa tet-off cells and treated with oligo-dT and RNase H. (H) Western blots showing proteins co-immunoprecipitating (IP, right panels) with indicated FLAG-MS2-GFP fusion proteins expressed in HEK293T cells. Input samples corresponding to 2.5% of IPs are shown on the left. *, p < 0.05, **, p < 0.01; student's two-tailed t-test.
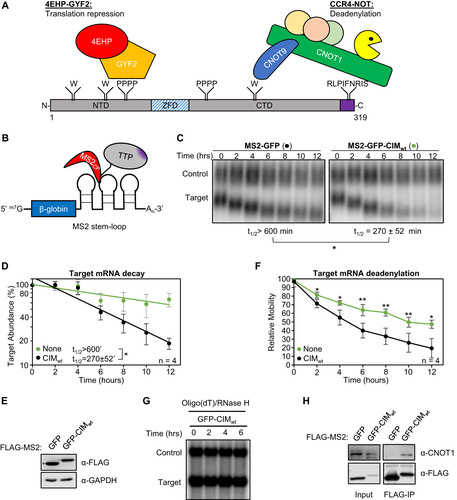
FIG 2 The TTP CIM promotes mRNA decay cooperatively with conserved TTP tryptophans. (A) Representative Northern blots monitoring mRNA decay of β-globin mRNA tethered to TTP-CTD wild-type (wt) or mutant proteins with the CIM deleted (ΔCIM), conserved tryptophans mutated to alanines (WA), or both (WA,ΔCIM). (B) Graph quantifying four repeats of mRNA decay assays in panel A. Error bars represent standard deviation. (C) Western blots monitoring expression levels of TTP-CTD fusion proteins in panel A. (D) Same as panel A, but with wild-type or mutant MS2-TTP full-length fusion proteins. (E) Graph quantifying four repeats of mRNA decay assays in panel D. (F) Western blots monitoring expression levels of TTP fusion proteins in panel D. (G) Western blots showing proteins co-immunoprecipitating (IP, right panels) with the indicated FLAG-tagged MS2-TTP-CTD fusion proteins from HEK293T cells after treatment with RNase A, as compared with input samples (left). IP samples correspond to 2.5% of the input. (H) Same as panel G, but monitoring proteins associated with FLAG-tagged MS2-TTP fusion proteins. *, p < 0.05; Student's two-tailed t-test.
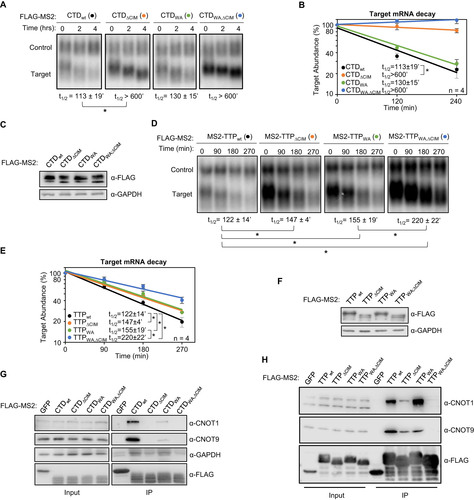
TABLE 1 TTP mutant proteins
FIG 3 TTP tetraproline motifs do not enhance TTP mRNA decay activity. (A) Representative Northern blots monitoring mRNA decay of β-globin mRNA tethered to indicated MS2-TTP wild-type (wt) or mutant proteins with the tetraproline motifs mutated to serines (PS), the CIM deleted (ΔCIM), or both (PS,ΔCIM). (B) Graph quantifying three repeats of mRNA decay assays in panel A. Error bars represent standard deviation. (C) Western blots monitoring expression levels of TTP fusion proteins in panel A. (D) Same as panel A, with indicated mutant MS2-TTP fusion proteins with tetraproline motifs mutated to serines and conserved tryptophans to alanines (PS,WA), or additional deletion of the CIM (PS,WA,ΔCIM). (E) Graph quantifying four repeats of mRNA decay assays in panel D. (F) Western blots monitoring expression levels of TTP fusion proteins in panel D. (G) Bar-graph comparing half-lives of β-globin mRNA tethered to the indicated MS2-TTP fusion proteins with or without mutation in tetraproline motifs (PS). Error bars represent standard deviation from 3 or 4 experiments. (H) Western blots showing proteins co-immunoprecipitating (IP, right panels) with indicated FLAG-tagged MS2-TTP fusion proteins from HEK293T cells after treatment with RNase A, as compared with input samples (left). IP samples correspond to 2.5% of the input. *, p < 0.05; n.s., p > 0.05; Student's two-tailed t-test.
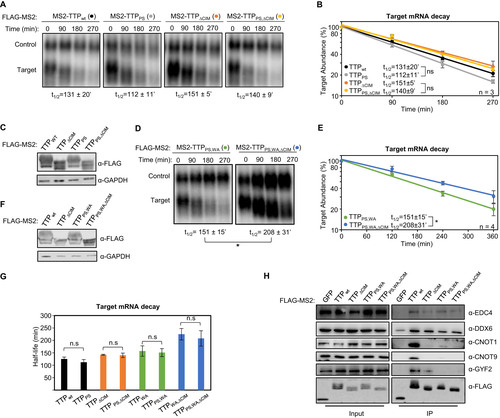
FIG 4 TTP serine 316 is phosphorylated during TTP induction. (A) Western blot validating the anti-pS316-TTP antibody of indicated FLAG-MS2-TTP fusion proteins expressed in HEK293T cells incubated with or without okadaic acid (OA) and treated following cell lysis without (left panels) or with (+ phosphatase, right panels) calf-alkaline phosphatase in the presence or absence of phosphatase inhibitor (PhosphataseArrest I), prior to Western blotting using the anti-pS316-TTP antibody as compared with TTP and UPF1 controls. (B) Western blots monitoring levels of TTP and its phosphorylation at serine 316 (pS316-TTP) in serum-shocked mouse NIH 3T3 cells. GAPDH serves as a loading control. (C) Same as panel B, but monitoring TTP in LPS-induced RAW 264.7 mouse macrophage cells.
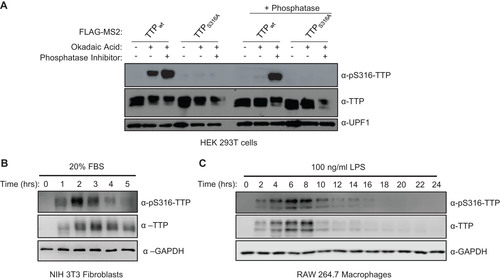
FIG 5 TTP serine 316 is phosphorylated by kinase(s) other than MK2. (A) Western blots monitoring TTP and its phosphorylation at serine 316 (pS316-TTP) or serine 178 (pS178-TTP), exogenously expressed in HeLa cells incubated with inhibitors of p38 (SB203580) or PKC (Gö 6983) kinases. The left lane is a control sample from HeLa cells not expressing TTP. UPF1 served as a loading control. (B) Western blots monitoring phosphorylation of exogenous FLAG-tagged TTP co-expressed with FLAG-tagged, constitutive active or catalytic dead, MK2 or PKCα kinases in HEK293T cells. (C) Western blots monitoring phosphorylation of FLAG-tagged GFP-CIM fusion protein co-expressed with indicated constitutive active kinases in HEK293T cells. (D) Western blots monitoring phosphorylation of FLAG-tagged GFP-CIM and GFP-CIM S316A mutant fusion proteins co-expressed with constitutive active or catalytic dead PKCα kinase in HeLa cells.
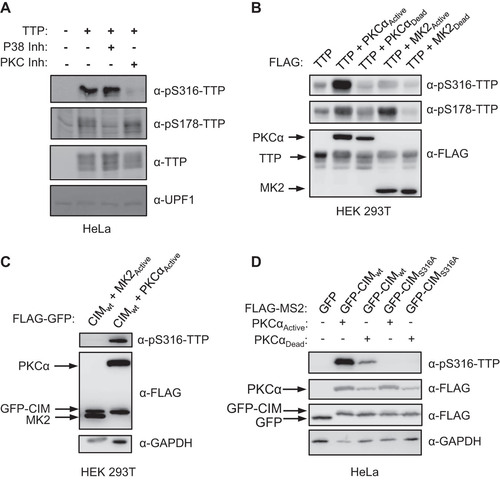
FIG 6 The TTP-CIM remains active in the presence of active MK2. (A) Representative Northern blots monitoring mRNA decay of β-globin mRNA tethered to MS2-TTP wild-type (wt) or ΔCIM proteins, co-expressed with constitutive active (MK2A) or catalytic dead (MK2D) MK2 kinase. (B) Western blots monitoring expression levels of TTP and MK2 proteins in panel A. Note, MS2-GFP and MK2 migrate similarly. (C) Graph quantifying six repeats of mRNA decay assays in panel A. Error bars represent standard deviation. (D) Graph quantifying three repeats of mRNA decay assays as in panel A but quantified by RT-qPCR rather than Northern blotting. (E) Representative Northern blots monitoring mRNA decay of β-globin mRNA tethered to MS2-TTP or MS2-TTP ΔCIM, each with alanine mutations at serines 52 and 178 (2A) and co-expressed with constitutive active MK2 (MK2A). (F) Graph quantifying four repeats of mRNA decay assays monitoring MS2-TTP ΔCIM with and without alanine mutations at serines 52 and 178 (2A) in the presence of active MK2 (MK2A). (G) Western blots monitoring expression levels of TTP and MK2 proteins in panels E and F. (H) Western blot showing proteins co-immunoprecipitating (IP, right panels) with indicated FLAG-tagged TTP proteins expressed in HEK293T cells treated with or without okadaic acid (OA). Input samples corresponding to 2.5% of IPs are shown on the left. *, p < 0.05, **, p < 0.01; Student's two-tailed t-test.
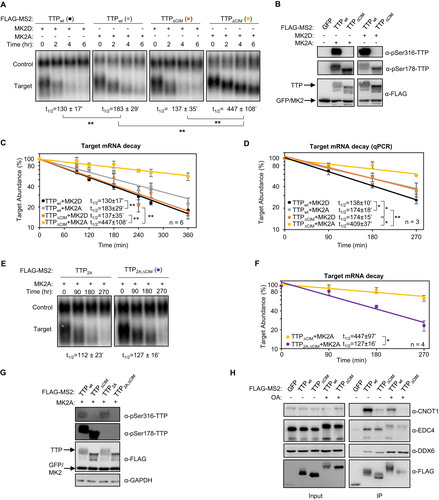
FIG 7 TTP activity is highly dependent on an intact CIM in the presence of MK2. (A, C) Representative Northern blots (n = 3) monitoring degradation of β-globin mRNA tethered to indicated MS2-TTP fusion proteins in the presence of constitutive active (MK2A) or catalytically dead (MK2D) MK2 kinase in HeLa tet-off cells. (B, D) Western blots monitoring expression levels of TTP fusion proteins in the experiments in panels A and C, respectively. *, p < 0.05; Student's two-tailed t-test.
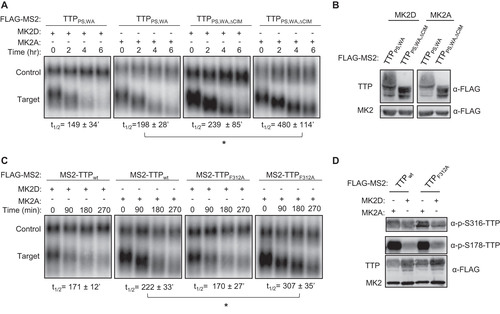
FIG 8 TTP-mediated ARE-mRNA decay is highly dependent of the CIM in the presence of active MK2. (A) Representative Northern blots monitoring mRNA decay of β-globin mRNA containing an ARE from GM-CSF mRNA, in the presence of TTP wild-type (wt) or ΔCIM proteins, co-expressed with constitutive active (MK2A) or catalytic dead (MK2D) MK2 kinase. (B) Western blots monitoring expression levels of TTP and MK2 proteins in panel A. Note, FLAG-MS2-GFP migrates similarly to FLAG-MK2. (C) Graph quantifying three repeats of mRNA decay assays in panel A. Error bars represent standard deviation. *, p < 0.05; Student's two-tailed t-test.
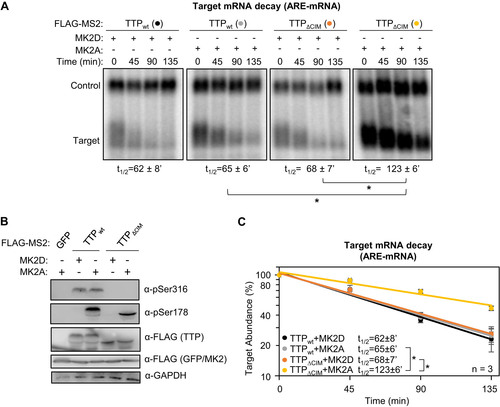
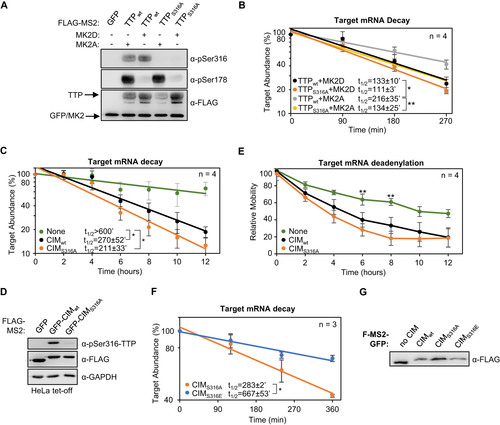
FIG 9 TTP-CIM activity is regulated by phosphorylation independently of MK2. (A) Western blots monitoring phosphorylation of MS2-TTP wild-type (wt) or S316A mutant fusion proteins in the presence of constitutive active (MK2A) or catalytic dead (MK2D) MK2 kinase in HeLa Tet-off cells. (B) Graph quantifying four repeats of mRNA decay assays for β-globin mRNA tethered to MS2-TTP proteins co-expressed with constitutive active (MK2A) or catalytic dead (MK2D) MK2 kinase. Error bars represent standard deviation. (C) Graph quantifying four repeats of mRNA decay assays for β-globin mRNA tethered to indicated MS2-GFP fusion proteins in HeLa Tet-off cells (none: MS2-GFP alone). (D) Western blots monitoring TTP phosphorylation and TTP and MK2 expression levels in panel C. (E) Graph showing relative band mobility as a measure of mRNA deadenylation from the experiments graphed in panel C, measured as described for Note, the control experiments (None and CIMWT) in panels C-E are identical to the experiments presented in to . (F) Graph quantifying three repeats of mRNA decay assays for β-globin mRNA tethered to indicated MS2-GFP-CIM fusion proteins in HeLa Tet-off cells, monitored by RT-qPCR. (G) Western blot monitoring expression levels of fusion proteins in panel F. *, p < 0.05, **, p < 0.01, Student's two-tailed t-test.