Figures & data
FIG 1 Impaired insulin-mediated signaling and heart failure in iCIR2KO and iCIRS12KO hearts. Two-way ANOVA was performed to analyze differences after insulin stimulation by genotype, followed by Newman-Keuls post hoc analysis (#, P < 0.05 for insulin stimulation; $, P < 0.05 for genotype; &, P < 0.05 for the interaction between insulin stimulation and genotype; these symbol definitions apply to symbols used not in the figure itself but in the panel descriptions below). (A) Representative immunoblots for IR and IGF1R in ventricle homogenates from mice with genotypes at time points as indicated. DOX, doxycycline. (B) Survival curves (n = 11 or 12). (C to E) Time course for ejection fraction (n = 7 or 8) (C), representative M-mode images (D), and representative trichrome stains (scale bar, 50 μm) (E) showing time-dependent heart failure, myocyte disarray, and fibrosis in iCIR2KO mice. (F to H) Impaired time-dependent phosphorylation of Akt in iCIR2KO hearts at Ser473 (#) (G) and Thr308 (# and $) (H) sites after injection of 0.001 U insulin (Ins) into the inferior vena cava as indicated (n = 4). Lanes in panel F were run on the same gel but were noncontiguous. GAPDH, glyceraldehyde-3-phosphate dehydrogenase; AU, arbitrary units. (I) Representative immunoblots for IRS1 and IRS2 in ventricle homogenates from mice with genotypes at time points as indicated. (J) Survival curves (n = 8 to 10). (K to M) Time course for ejection fraction (n = 6 to 13) (K), representative M-mode images (L), and representative trichrome stains (scale bar, 50 μm) (M) indicating time-dependent heart failure, myocyte disarray, and fibrosis. (N to P) Impaired time-dependent phosphorylation of Akt in iCIRS12KO hearts at Ser473 ($ and &) (O) and Thr308 ($ and &) (P) sites after injection of 0.001 U insulin into the inferior vena cava as indicated (n = 4). Lanes in panel N were run on the same gel but were noncontiguous. *, P < 0.05 versus WT at same time point or WT at same insulin concentration; †, P < 0.05 versus same genotype and time point with no insulin.
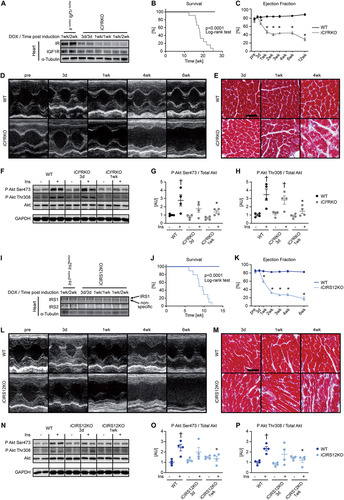
FIG 2 BCAA treatment decreases autophagy but does not attenuate heart failure in iCIR2KO mice. Two-way ANOVA was performed to analyze differences by genotype and chloroquine (CQ) injection, followed by Newman-Keuls post hoc analysis (#, P < 0.05 for CQ injection; $, P < 0.05 for genotype; &, P < 0.05 for the interaction between CQ injection and genotype; these symbol definitions apply to symbols used not in the figure itself but in the panel descriptions below). (A to D) Autophagic flux determined after CQ injection as measured by LC3-II/LC3-I (#, $, and &) (B), LC3-II/GAPDH (# and $) (C), and p62/GAPDH immunoblotting (# and &) (D). Panel A shows a representative immunoblot. Two-way ANOVA was performed to analyze differences by genotype and BCAA treatment, followed by Newman-Keuls post hoc analysis (¦, P < 0.05 for BCAA treatment; $, P < 0.05 for genotype; ^, P < 0.05 for the interaction between BCAA treatment and genotype). (E to L) Representative immunoblots (E) and quantification (F to L) from ventricle homogenates obtained from iCIR2KO and WT mice after saline or BCAA treatment 1 week after gene deletion. Lanes in panel E were run on the same gel but were noncontiguous. (F) P Akt Ser473/total Akt ($). (G) P Akt Thr308/total Akt ($). (H) P S6 Ser235/236/total S6 ($ and ^). (I) BNIP3/GAPDH (¦, $, and ^). (J) LC3-II/LC3-I (^). (K) LC3-II/GAPDH (¦, ^). (L) p62/GAPDH ($). n = 6. (M to O) Ejection fraction ($) (M), left ventricular end-diastolic volume (LVEDV; # and $) (N), and left ventricular end-systolic volume (LVESV; $) (O) determined by transthoracic echocardiography 2 weeks after gene deletion (n = 5 to 11). *, P < 0.05 versus saline, same genotype; †, P < 0.05 versus WT, same treatment and same time point; ‡, P < 0.05 versus 3-day time point, same treatment.
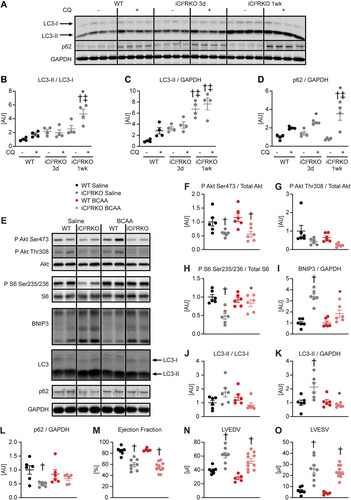
FIG 3 BCAA treatment decreases autophagy but does not attenuate heart failure in iCIRS12KO mice. Two-way ANOVA was performed to analyze differences by genotype and chloroquine (CQ) injection, followed by Newman-Keuls post hoc analysis (#, P < 0.05 for CQ injection; $, P < 0.05 for genotype; &, P < 0.05 for the interaction between CQ injection and genotype; these symbol definitions apply to symbols used not in the figure itself but in the panel descriptions below). (A to D) Autophagic flux determined after CQ injection as measured by LC3-II/LC3-I (# and $) (B), LC3-II/GAPDH (# and $) (C), and p62/GAPDH immunoblotting (#, $, and &) (D). Panel A shows a representative immunoblot. Two-way ANOVA was performed to analyze differences by genotype and BCAA treatment, followed by Newman-Keuls post hoc analysis (¦, P < 0.05 for BCAA treatment; $, P < 0.05 for genotype; ^, P < 0.05 for the interaction between BCAA treatment and genotype). (E to L) Representative immunoblots (E) and quantification (F to L) from ventricle homogenates obtained from iCIRS12KO and WT mice after saline or BCAA treatment 1 week after gene deletion. Lanes in panel E were run on the same gel but were noncontiguous. (F) P Akt Ser473/total Akt (¦ and $). (G) P Akt Thr308/total Akt ($). (H) P S6 Ser235/236/total S6 (¦, $, and ^). (I) BNIP3/GAPDH ($). (J) LC3-II/LC3-I (¦, $, and ^). (K) LC3-II/GAPDH (¦). (L) p62/GAPDH (¦, $, and ^). n = 4 to 6. (M to O) Ejection fraction (M), left ventricular end-diastolic volume (N), and left ventricular end-systolic volume (O) ($ for each) determined by transthoracic echocardiography 2 weeks after gene deletion (n = 6 to 8). *, P < 0.05 versus saline, same genotype; †, P < 0.05 versus WT, same treatment and same time point; ‡, P < 0.05 versus 3-day time point, same treatment.
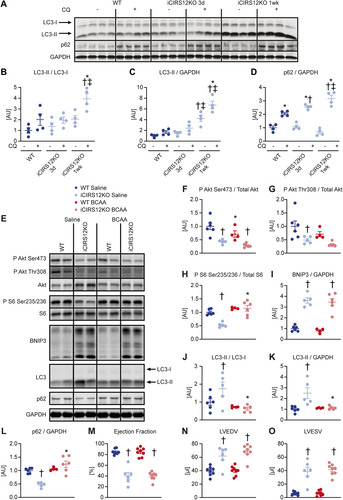
FIG 4 Decreased expression of genes that encode sarcomeric proteins in iCIR2KO and iCIRS12KO hearts 3 days post gene deletion. (A) Heat map depicting the fold change in gene expression in left ventricular apex tissue obtained from iCIR2KO and iCIRS12KO mice 3 days following tamoxifen-induced gene recombination relative to corresponding WT controls (|fold change| > 1.5 relative to WT controls and P < 0.05; n = 4 or 5). (B) Summary of genes that are differentially expressed relative to corresponding WT controls (|fold change| > 1.5 relative to WT controls and P < 0.05). (C and D) Decreased mRNA expression of genes encoding sarcomeric and gap junction proteins in iCIR2KO and iCIRS12KO hearts at the 3-day time point as confirmed by RT-PCR. Data are expressed as fold change relative to WT controls of the same age (assigned as 1.0; dashed line) and normalized to Rps16 (n = 5 or 6). *, P < 0.05 versus WT, same time point. (E and F) Volcano plots highlighting expression levels of SRF targets in iCIR2KO and iCIR12KO hearts. Cutoffs illustrated by dashed lines indicate a P value of <0.05 (equals −log10 of ~1.30) and a |fold change| of >1.25 (equals |log2 fold change| of ~0.322). (G and H) Enrichment plots for SRF target genes by gene set enrichment analysis (GSEA) in iCIR2KO and iCIRS12KO hearts, with the y axis representing enrichment scores (ES) and the x axis indicating SRF target genes represented in the gene set (indicated as “hits”). The enrichment profile depicted by the green line connects ES and genes. NES, normalized enrichment score. The arrow indicates the point of maximal distance of the ES from the baseline as assessed by genes of the core enrichment set (CES). Lower plots in gray present all significant genes in rank order according to the signal-to-noise metric (n = 3,184 for iCIR2KO hearts and n = 3,085 for iCIRS12KO hearts; cutoff, P < 0.05). The dashed line separates SRF target genes that are positively (red) and negatively (blue) correlated with loss of cardiac IR/IGF1R signaling and IRS1/IRS2 signaling, respectively, with the colored band indicating the degree of correlation.
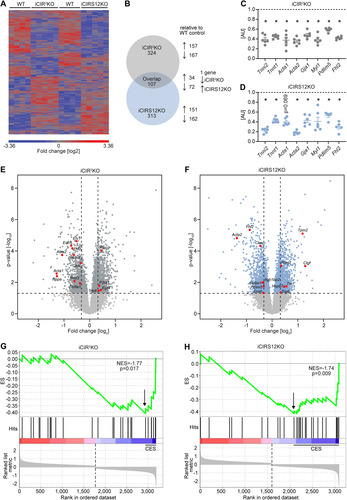
FIG 5 Disruption of sarcomeric integrity and cardiac structure in iCIR2KO and iCIRS12KO hearts. (A and B) Representative immunoblots and quantification from ventricle homogenates obtained from iCIR2KO and iCIRS12KO mice at time points as indicated. Data are expressed as fold change relative to WT controls at the same time point (assigned as 1.0; dashed line, n = 6). TNNI2, troponin I type 2; ACTA1, alpha 1 skeletal muscle actin; ACTA2, alpha 2 smooth muscle actin; LIMP-2, lysosome membrane protein 2; GJA1, gap junction protein alpha 1; MYL1, myosin light chain 1. *, P < 0.05 versus WT, same time point. (C and D) Representative electron micrographs of iCIR2KO (C) and iCIRS12KO (D) hearts 3 days and 1 week after gene deletion showing disrupted Z lines (indicated by black arrows), M lines (white arrows), and intercalated discs (arrowheads). Scale bars, 1 μm.
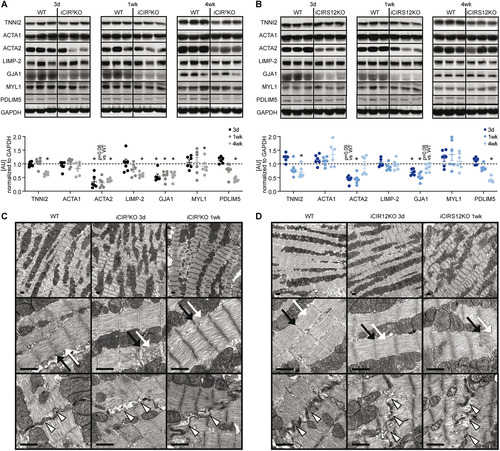
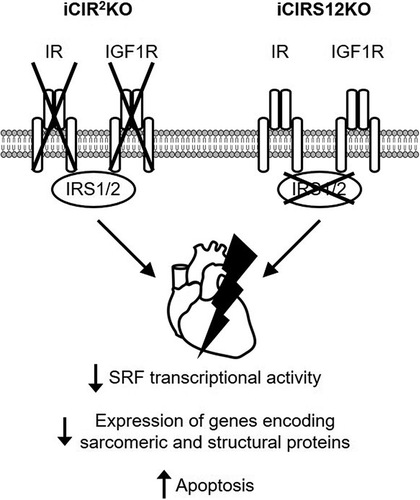
FIG 6 Mechanisms for the rapid onset of heart failure in iCIR2KO and iCIRS12KO mice. Disruption of insulin and IGF1 signaling in iCIR2KO and iCIRS12KO hearts attenuates SRF transcriptional activity, which results in impaired transcription of genes encoding sarcomeric and structural proteins. This mechanism in concert with increased apoptosis leads to the rapid onset of heart failure.