
Figures & data
FIG 1 Store depletion reduces AKAP79 mobility at the cell periphery. (A) Images show AKAP79-YFP expression at the cell surface before (labeled Rest) and after photobleaching in an unstimulated cell and in a cell exposed to thapsigargin (Thap; 2 μM for 10 min). The white square depicts the photobleached area. (B) Aggregate data are shown comparing the time course of FRAP between unstimulated and thapsigargin-treated cells. The unstimulated trace is the mean of 8 cells and the thapsigargin (Thap) trace is the mean of 12 cells. (C) Box plots compare t1/2 and mobile fraction for the conditions shown. Median is depicted by the straight line within each box. (D) The kinetics of FRAP are compared between 28 unstimulated cells and 23 cells exposed to thapsigargin. (E) Box plots compare t1/2 and mobile fraction for the conditions indicated. (F) The time course of FRAP is shown for unstimulated cells (9 cells), and in punctate (11 cells) and non-punctate (12 cells) regions of the cell periphery after thapsigargin treatment. (G) The mobile fraction is compared for the conditions indicated. For the data in panels D-G, STIM1 and myc-tagged Orai1 were also expressed. Scale bar denotes 2 μm.
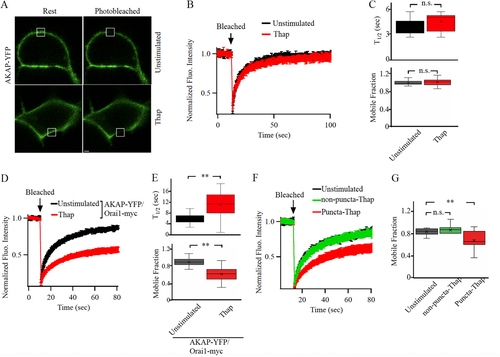
FIG 2 AKAP79-YFP diffusion is reduced in Orai1-containing punctate regions of the cell periphery. (A) Images show expression of AKAP79-YFP and Orai1-cherry at the cell surface in an unstimulated cell and in one treated with thapsigargin (Thap). The photobleached area is shown in white. (B) The time course of FRAP is compared between 15 unstimulated cells and 11 cells treated with thapisgargin. (C) Box plot compares t1/2 for the conditions indicated. In (B) and (C), FRAP was carried out at punctate regions of the membrane after thapsigargin treatment. (D) Mobile fraction is compared for the conditions shown.
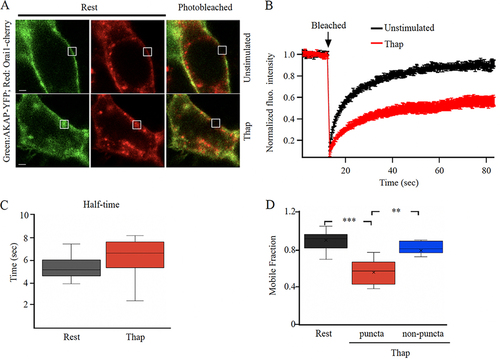
FIG 3 Targeting the AKAR region on Orai1 accelerate AKAP79-YFP recovery from photobleaching after store depletion. (A) AKAP79-YFP mobility is not reduced after store depletion in the absence of Orai expression. In this experiment, Orai1 triple knockout cells were used and cells co-expressed AKAP79-YFP and STIM1-cherry. Upper panels compare mobile fraction and t1/2 for the conditions shown. Lower images compare AKAP79-YFP and STIM1-cherry distribution after stimulation with thapsigargin. All images were taken in the presence of thapsigargin. (B) Images compare NFAT1-GFP translocation to the nucleus following treatment with thapsigargin for the times indicated. Control denotes a cell transfected with scrambled AKAR plasmid and AKAR represents a cell transfected with AKAR plasmid. (C) Aggregate data as in panel B are compared. Control group denotes 24 cells and AKAR group 21 cells. (D) Images show expression of AKAP79-YFP at the cell periphery before and after photobleaching cells transfected with AKAR plasmid. The photobleached area is shown in white. (E) The graph compares the time course of FRAP for the conditions shown following AKAR expression. Unstimulated trace represents the mean of 13 cells and thapsigargin (Thap) trace denotes 14 cells. (F) Mobile fraction is compared. In panels (D) to (F), STIM1 and myc-tagged Orai1 were also overexpressed.
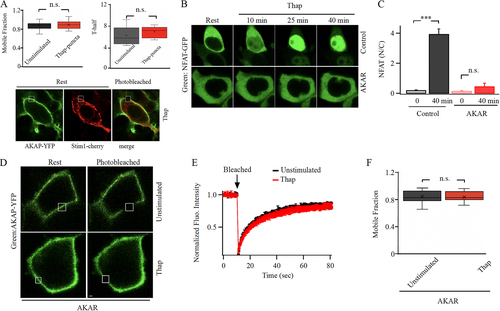
FIG 4 The long form of Orai1 interacts with AKAP79. (A) Proximity ligation assay shows close association between long Orai1 and AKAP79 after store depletion but not for short Orai1. (B) Aggregate data from experiments as in panel (A) are compared. Each bar is >30 cells. Data are mean ± SEM. (C) Images show AKAP79-YFP surface expression before and after photobleaching in cells expressing either long or short FLAG-tagged Orai1. (D) Kinetics of AKAP79-YFP FRAP before and after store depletion are compared between cells expressing long or short Orai1. Each trace is the mean of 9 to 13 cells. (E) The box plot compares mobile fraction for the conditions depicted. In all experiments, the Orai triple knock out HEK293 cell line was used. Long and short Orai1 were expressed at similar levels, as gauged by anti-FLAG staining.
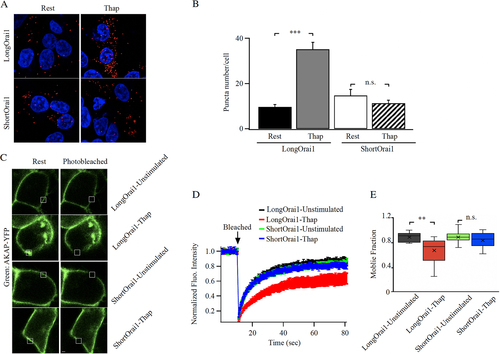
FIG 5 Kinetics of STIM1-Orai1 interaction probed using FRAP. (A) Images show expression of STIM1-YFP and Orai1-cherry before and after store depletion. (B) Time course of FRAP is compared for the conditions shown. Each graph is the mean of 12 to 13 cells. (C) Box plot shows the mobile fraction for each condition.
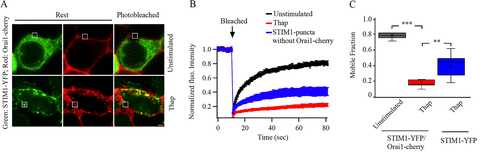
FIG 6 Altering Ca2+-dependent fast inactivation has little effect on NFAT nuclear translocation. (A) Images compare nuclear translocation of NFAT1-cherry in Orai triple knock out HEK293 cells expressing the long form of Orai1, under conditions where the rate and extent of fast inactivation is altered. The short form of Orai1 does not interact with AKAP79 and hence does not cause nuclear translocation of NFAT1 (Citation21). (B) Aggregate data from several experiments as in panel (A) are compared. Each point is the mean of 11–13 cells.
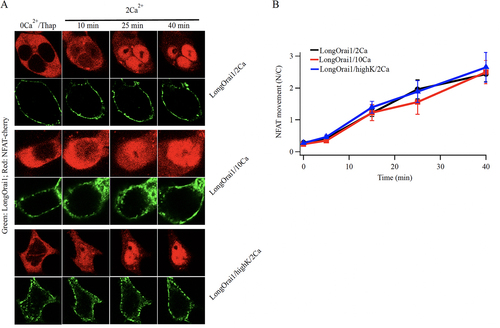
FIG 7 NFAT1 dissociates from AKAP79 following local Ca2+ entry through CRAC channels. (A) Airy scan confocal images show co-localization of NFAT1-cherry and AKAP79 close to the cell periphery in unstimulated cells in Ca2+-free (0Ca) external solution, and after exposure to thapsigargin (Thap) in Ca2+-free external solution (0Ca/Thap). After Ca2+ readmission, NFAT1 dissociates from AKAP79 and translocates to the nucleus. Images show responses at different times after Ca2+ readmission (2Ca/Thap). (B) The time course of loss of co-localization of NFAT1 with AKAP79 is shown (red trace). Included in the graph is the time course of NFAT1 translocation into the nucleus in the same cells (black trace). Each point is mean ± SEM of 26 to 30 cells. (C), Loading the cytosol with the slow Ca2+ chelator EGTA (30 min pre-exposure to 10 μM EGTA-AM) does not prevent NFAT1 dissociation from AKAP79 (upper graph). Each point is the mean ± SEM of 25 cells. Loading the cytosol with the fast Ca2+ chelator BAPTA (30 min pre-exposure to 10 μM BAPTA-AM) prevented dissociation of NFAT from AKAP79 (lower graph). Each point is the mean ± SEM of 16 cells. (D) Expression of the AKAR peptide prevents Ca2+ entry through CRAC channels from releasing NFAT1 from AKAP79. Each point is the mean ± SEM of 16 cells. (E) Time course of NFAT1 co-localization with AKAP79 is shown. In these experiments, activation of CRAC channels triggered dissociation of NFAT1 from AKAP79. After 20 min, BTP2 and cyclosporine A were added, to prevent activation of calcineurin. Each point is the mean ± SEM of 14 cells.
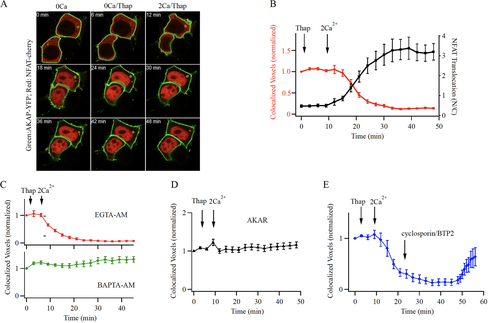
FIG 8 NFAT redistribution following stimulation in 3D-reconstruction of Z-slices spanning the entire cell. (A) Image shows a resting, non-stimulated cell. (B) A cell after stimulation with thapsigargin is shown. Scale bars are all 10 μm. (C) Aggregate data are compared for the different cellular compartments (cell periphery, cytosol and nucleus). Rest versus thapsigargin was significantly different in all 3 groups (P < 0.05 for PM, P < 0.001 for Cytosol and for Nucleus).
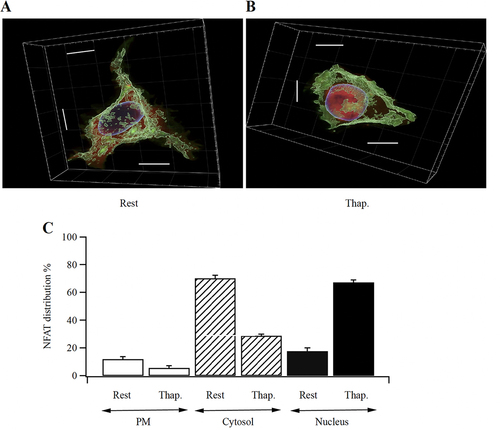
FIG 9 Mathematical model for NFAT-AKAP79 plasma membrane dynamics. (A) Cartoon summarizes the various steps in the model. See for definitions. (B) Graph simulates how the various parameters change following CRAC channel activation and then inhibition, shown between the dotted lines. (C) Simulations are superimposed on original data (), for different levels of nuclear export.
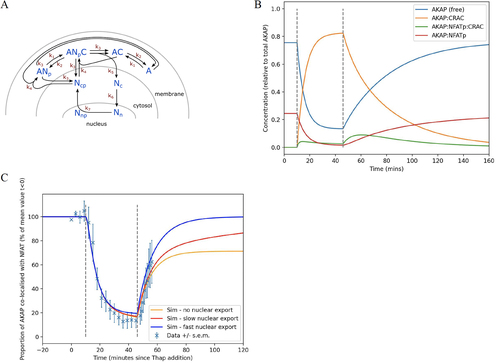
TABLE 1 Model variables and parameters and their descriptions
TABLE 2 Fitted parameter values for the model shown in