Figures & data
Table 1 Baseline Characteristics in the Study Population.
Table 2 Genotypic Frequencies Distribution and Analysis Between all WHO Groups.
Table 3 Genotypic Frequencies Distribution and Analysis Between Astrocytomas (Grades 1 + 2×Grades 3 + 4).
Table 4 Genotypic Frequencies Distribution and Analysis Between Astrocytomas (Grades 2 × 3 + 4).
Figure 1 Immunoexpression for the five proteins TCTP, mTOR, MDM2, p53 and p21. Left column shows astrocytomas grade 1 and right column shows astrocytomas grade 4 (IHC, 200x).
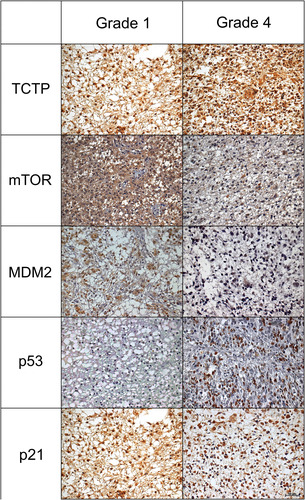
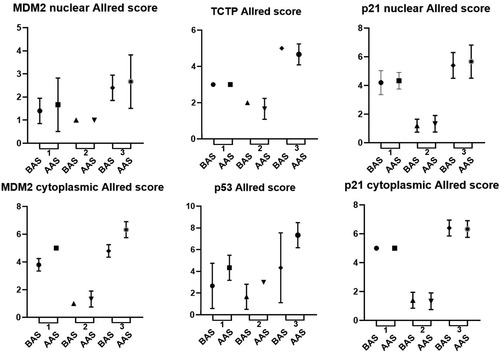
Figure 2 Survival and immunoexpression proteins (TCTP, MDM2, p53 and p21) distribution in glioblastomas (group 4). Survival was classified into two groups considering the mean of survival: below average survival (BAS) and above average survival (AAS). The proteins were evaluated according to the Allred value (distribution, intensity, Allred score). Each graphic has 3 analyses: 1 for distribution in below and above average survival; 2 for intensity in below and above average survival; 3 for Allred score in below and above average survival.