Figures & data
Figure 1 Glutamate-glutamine cycle-related proteins are upregulated in mouse astrocytes during aging. (A–D) Embedding plots displaying reads of Slc1a3 (GLAST), Glul (GS), and Slc1a2 (GLT-1) in distinct cell classes in the brain of young (2-3 months) and aged (21-22 months) mice following single-cell RNAseq analysis (extracted from CitationXimerakis et al., 2019). Cell classes are indicated by color. (E–G) Bulk RNA-seq reads of (E) Slc1a3 (GLAST), (F) Slc1a2 (GLT-1) and (G) Glul (GS) in isolated astrocytes from hippocampi of mice in different ages (extracted from CitationClarke et al., 2018 dataset). Readings are plotted as FPKM (Fragments Per Kilobase Million); Individual data points are plotted and represent individual animals (n = 3 animals/group). One-way ANOVA followed by Tukey multiple comparison test was performed. ****: p < 0.001; ***: p < 0.005; **: p < 0.01; *: p < 0.05.
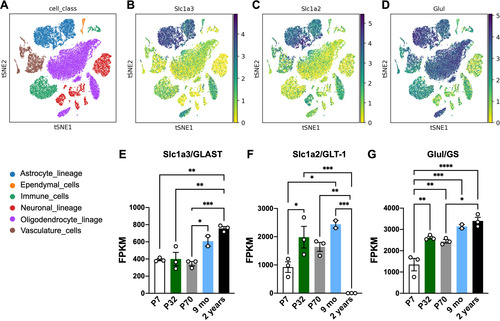
Figure 2 Levels and activity of glutamate transporters and GS are upregulated in senescent astrocytes in vitro. (A) Primary murine astrocyte cultures were maintained for 10 DIV (control group) or 30–35 DIV (senescent group) followed by immunocytochemical and PCR assays of the glutamate transporters, GLT-1 and GLAST, and the enzyme, GS, and evaluation of GS activity and aspartate uptake assays. (B–E) Increased immunostaining intensity and expression of GLAST (B–E) and GLT-1 (F–I) in senescent astrocyte cultures compared to the control group. (J–M) Increased immunolabeling intensity of GS in senescent astrocytes. (N-O) Upregulated GS activity and [3H]-D-aspartate uptake in senescent astrocytes compared to control cultures. Scale bar, 20 μm. Individual data points are plotted and represent individual cultures (n = 3–10 cultures/group). Significance was determined using the unpaired t-test. Error bars represent ± SEM. **: p < 0.01; *: p < 0.05. RPLP0: ribosomal protein lateral stalk subunit P0.
![Figure 2 Levels and activity of glutamate transporters and GS are upregulated in senescent astrocytes in vitro. (A) Primary murine astrocyte cultures were maintained for 10 DIV (control group) or 30–35 DIV (senescent group) followed by immunocytochemical and PCR assays of the glutamate transporters, GLT-1 and GLAST, and the enzyme, GS, and evaluation of GS activity and aspartate uptake assays. (B–E) Increased immunostaining intensity and expression of GLAST (B–E) and GLT-1 (F–I) in senescent astrocyte cultures compared to the control group. (J–M) Increased immunolabeling intensity of GS in senescent astrocytes. (N-O) Upregulated GS activity and [3H]-D-aspartate uptake in senescent astrocytes compared to control cultures. Scale bar, 20 μm. Individual data points are plotted and represent individual cultures (n = 3–10 cultures/group). Significance was determined using the unpaired t-test. Error bars represent ± SEM. **: p < 0.01; *: p < 0.05. RPLP0: ribosomal protein lateral stalk subunit P0.](/cms/asset/7e80e4d2-1f40-49e9-b251-121a1d24c3ba/tasn_a_12426794_f0002.jpg)
Figure 3 GS levels and glutamate uptake are increased in the old mouse hippocampus. (A) Western blot analysis of GS levels in the hippocampus of 2-3-month-old mice (Young) compared to 18–25 months-old mice (Aged) revealed increased protein levels upon aging. (B) Unchanged enzymatic activity of GS was observed between young and aged mice. (C) Augmented [3H]-D-aspartate uptake in the hippocampus of aged mice compared to young mice. Individual data points are plotted and represent individual animals (n = 4–10 animals/group). Significance was determined using the unpaired t-test. Error bars represent ± SEM. *: p < 0.05. GS: glutamine synthetase.
![Figure 3 GS levels and glutamate uptake are increased in the old mouse hippocampus. (A) Western blot analysis of GS levels in the hippocampus of 2-3-month-old mice (Young) compared to 18–25 months-old mice (Aged) revealed increased protein levels upon aging. (B) Unchanged enzymatic activity of GS was observed between young and aged mice. (C) Augmented [3H]-D-aspartate uptake in the hippocampus of aged mice compared to young mice. Individual data points are plotted and represent individual animals (n = 4–10 animals/group). Significance was determined using the unpaired t-test. Error bars represent ± SEM. *: p < 0.05. GS: glutamine synthetase.](/cms/asset/433e6910-c49a-4311-af9f-b09573833052/tasn_a_12426794_f0003.jpg)
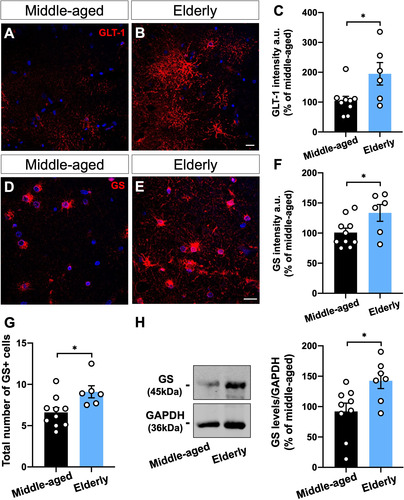
Figure 4 GS and GLT-1 are upregulated in the human brain upon aging. (A-C) Densitometric analysis of GLT-1 (A-B) and GS (D-E) immunostaining at the hippocampal dentate gyrus, including granule cell layer (CGL), molecular layer (ML), and polymorphic layer (PL), from human post-mortem tissue of middle-aged and elderly donors revealed an overall increased intensity of both proteins upon aging (A–F). Images represent the ML (A, B) and PL (D, E). (G) Immunostaining revealed a higher number of GS + cells in the elderly dentate gyrus than in the middle-aged ones. (H) GS protein level was increased in the dentate gyrus of elderly donors compared with middle-aged cases. Scale bars, 20 μm. Individual data points are plotted and represent individual donors (n = 6–10 donors/group). Significance was determined using the unpaired t-test. Error bars represent ± SEM. *: p < 0.05.