Figures & data
Table 1 Materials and Reagents Used.
Table 2 Antibodies Used in Immunohistochemistry and ELISA.
Table 3 Sequence of Primers Used for qPCR Analysis.
Table 4 Antibodies Used in Flow Cytometry.
Figure 1 Migration of transplanted CFSE + -BMCs to the lesion area and effect of BMC transplant on MBP levels. (a) BMCs were labeled with CFSE prior to transplant and animals were then sacrificed 3, 7, and 14 dpi (7 and 14 dpi are shown in Supplemental Figure 1). Representative epifluorescence microscopy images obtained from longitudinal sections of the lesion area (40x and 100x). CFSE+ cells (green) and nuclei counterstained with DAPI (blue). Insets in merged images show digital amplifications of areas in dotted line boxes. (b) Immunodetection of MBP through ELISA in homogenates of sham nerves and distal areas of ipsilateral nerves of non-treated (white) or BMC-transplanted animals (gray), 1, 3, 7, 10, 14, and 35 dpi. Absorbance values (492 nm) obtained in three independent experiments (one animal per experimental group) were normalized to the sham nerve and are expressed as the mean ± SD. Statistical analysis performed through two-way ANOVA (p value for interacting significance: .0003), followed by Bonferroni’s multiple comparison post-test (* p < .05; ** p < .01; *** p < .001). ANOVA: analysis of variance; BMC: bone marrow cell; CFSE: carboxyfluoresceinsuccinimidyl ester; DAPI: 4′,6-diamidino-2-phenylindole; ELISA: enzyme-linked immunosorbent assay; MBP: myelin basic protein; ns: not significant; SD: standard deviation.
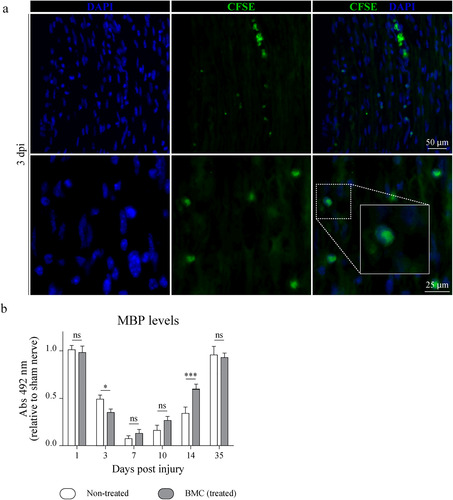
Figure 2 Effect of BMC transplant on bIII-tubulin and MBP organization. Immunofluorescence detection of axonal marker bIII-tubulin (green) and myelinating SC MBP (red), nuclei counterstained with DAPI (blue) in cross-sections of control nerves and distal areas of ipsilateral nerves of non-treated and BMC-transplanted animals (a) 3 dpi and (b) 7, 10, and 14 dpi. Representative images obtained by confocal microscopy (40x). The bIII-tubulin and MBP immunostaining overlap (arrowheads), ovoid bodies (solid arrows), and incipient remyelinated axons (hollow arrows) are shown as digital amplifications of areas in dotted line boxes. BMC: bone marrow cell; DAPI: 4′,6-diamidino-2-phenylindole; MBP: myelin basic protein; SC: Schwann cell.
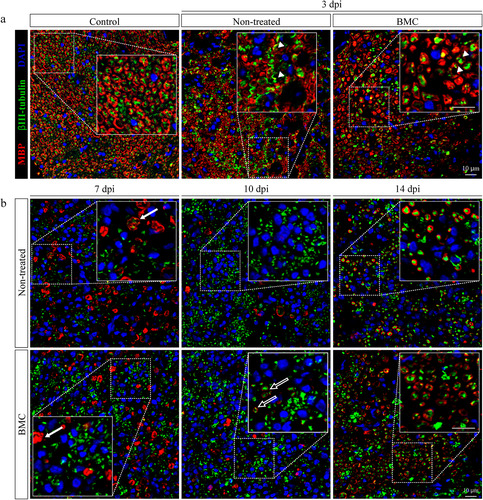
Figure 3 Effect of BMC transplant on functional parameters. (a) Representative photographs used to determine parameters required for SFI calculations. (b) Graphs summarizing values obtained for (b) SFI and (c) response time to hot stimulus. In both cases tests were performed on the same animal throughout survival times. Values were obtained in four independent experiments (one animal per experimental group) and are expressed as the mean ± SD. Statistical analysis performed through repeated measures two-way ANOVA (p value for interacting significance: SFI, < .0001; and response time to hot stimulus, < .0001), followed by Bonferroni’s multiple comparison post-test. Significance: * differences between ipsilateral legs of non-treated animals and BMC-transplanted animals; # differences between the ipsilateral and contralateral leg of non-treated animals; & differences between the ipsilateral and contralateral leg of BMC-transplanted animals (*/#/& p < .05; **/##/&& p < .01; ***/###/&&& p < .001). ANOVA: analysis of variance; BMC: bone marrow cell; ns: not significant; SFI: sciatic functional index.
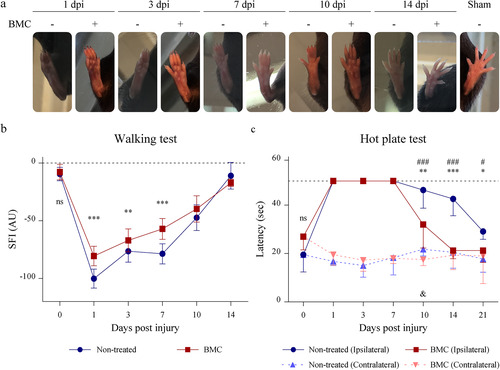
Figure 4 Gene expression of cytokines involved in the lesion-associated inflammatory process. Relative quantification of mRNA expression of (a) IL-1β, (b) TNFα, (c) IL-6, (d) IL-10, (e) TGFβ1, and (f) Arg-1. qPCRs were performed using cDNA synthesized from mRNA isolated from distal areas of injured sciatic nerves of non-treated and BMC-transplanted animals. GAPDH was used as a housekeeping gene. Heat maps represent Z-score values of data obtained in three independent experiments (one animal per experimental group). Statistical analysis performed through Student t-test comparing treated and non-treated animals within each survival time (* p < .05). Arg-1: arginase 1; BMC: bone marrow cell; cDNA: complementary DNA; GAPDH: glyceraldehyde 3-phosphate dehydrogenase; IL: interleukin; mRNA: messenger RNA; ns: not significant; qPCR: quantitative polymerase chain reaction; TGF: transforming growth factor; TNF: tumor necrosis factor.
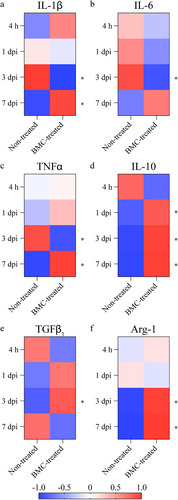
Figure 5 Quantification of pro-inflammatory and anti-inflammatory cytokines. Cytokine quantification performed on protein lysates obtained from distal stumps of injured sciatic nerves of non-treated (white box) and BMC-transplanted animals (gray box) through a bead-based immunoassay. Concentration of (a) IL-1β, (b) TNFα, (c) IL-6, (d) IL-10, and (e) free active form of TGFβ1 relativized to total protein in each sample previously estimated by Bradford’s assay. Values were obtained in three independent experiments (one animal per experimental group) and are expressed as the mean ± SD. Statistical analysis performed through two-way ANOVA(p value for interacting significance: IL-1β, .0002; TNFα, .0124; IL-6, .3335; IL-10, .0044; and free active form of TGFβ1, .0026), followed by Bonferroni’s multiple comparison post-test (* p < .05; ** p < .01; *** p < .001). ANOVA: analysis of variance; BMC: bone marrow cell; IL: interleukin; ns: not significant; TGF: transforming growth factor; TNF: tumor necrosis factor; SD: standard deviation.
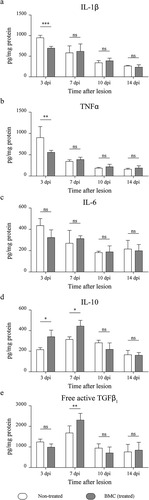
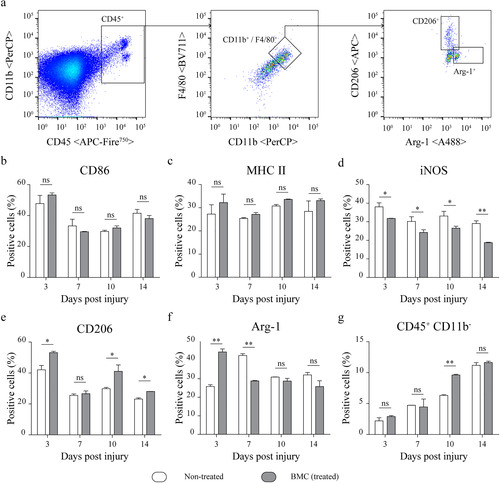
Figure 6 Lesion-associated macrophage phenotypes. Flow cytometry analysis of phenotype-specific macrophage markers performed on cell suspensions obtained by mechanical and enzymatic digestion of the distal portions of sciatic nerves dissected from non-treated (white) and BMC-transplanted animals (gray). (a) Representative graphs of the gating strategy used to select the CD45 + CD11b + F4/80+ population and analysis of macrophage markers (b) CD86, (c) MHC II, (d)iNOS, (e) CD206 and (f) Arg-1. (g) Proportion of CD45 + CD11b− cells. Bar graphs summarize values obtained in four independent experiments (one animal per experimental group) and expressed as the mean ± SD. Statistical analysis performed through two-way ANOVA (p value for interacting significance: CD86, .1110; MHC II, .7775; iNOS, .3055; CD206, .0166; Arg-1, < .001; and CD45 + CD11b− .0046), followed by Bonferroni’s multiple comparison post-test (* p < .05; ** p < .01). ANOVA: analysis of variance; Arg-1: arginase 1; BMC: bone marrow cell; iNOS: inducible nitric oxide synthase; MHC: major histocompatibility complex; ns: not significant; SD: standard deviation.