
Figures & data
Figure 1. Detail of the head of the bronze sculpture of Napoleon. Different cleaning problems are visible in the cheek (grayish/greenish in colour as Area 1), in the neck under the chin (black and shiny as Area 2) and in the shoulder (brilliant green colour as Area 3).
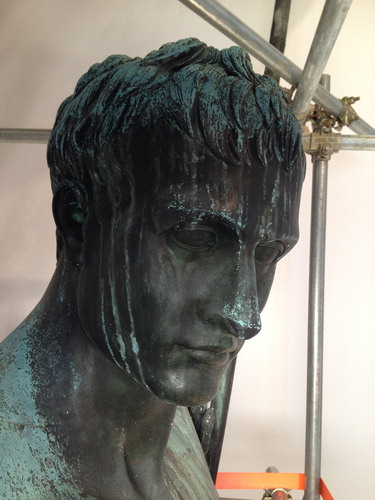
Figure 2. Test areas before cleaning: (A1) a mix of wax and Incralac® is present; (A2) a thick Incralac® layer makes the surface shiny; (A3) a typical green rain-washed corrosion patina.
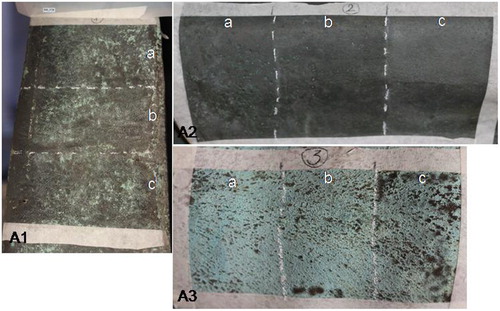
Figure 3. Area 1 test b. Left: before laser cleaning; right: after laser cleaning (bar = 1 mm).
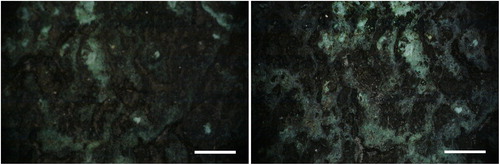
Figure 4. Area 1 test c. Left: before laser cleaning; right: after laser cleaning (bar = 1 mm).
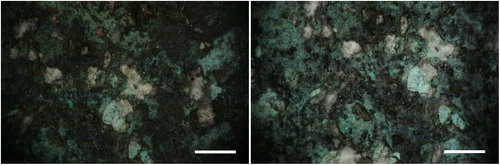
Figure 5. Area 3 test c. Left: before laser cleaning; right: after laser cleaning (bar = 1 mm).
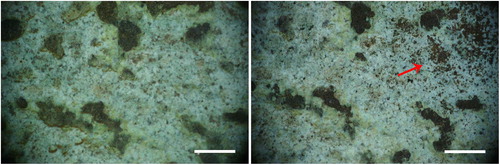
Figure 6. CIE L*a*b* average values measured on Area 1 (blue), Area 2 (red), and Area 3 (green) before (empty symbols) and after (full symbols) on the different sections. Symbols: Δ = a; □ = b; and ◊ = c.
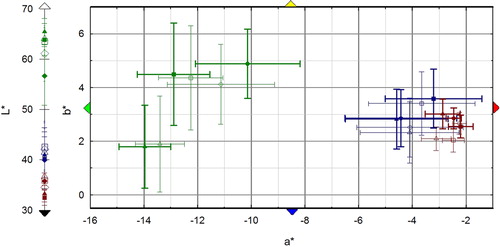
Figure 7. Low frequency impedance modulus as a function of laser cleaning conditions on the three tested areas.
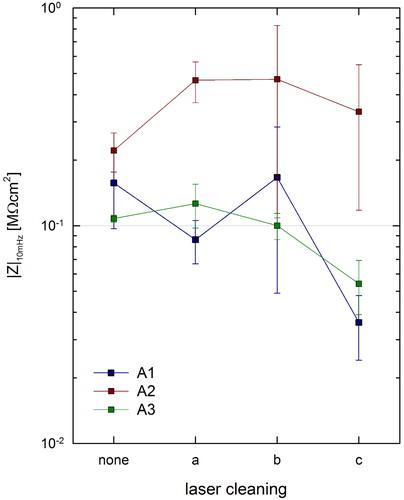
Figure 8. FTIR reflectance spectra of (I) reference double-layer coating acrylic resin (Incralac®)/microcrystalline wax laid on a bronze coupon; area 2a (II) before and (III) after laser cleaning. The removal of the coatings was evaluated through their typical peaks at 1465–1474 cm−1 (dotted-line square, microcrystalline wax) and 1723 cm−1 (dashed-line square, acrylic resin). Antlerite (*) and brochantite (°) were also found before and after cleaning. Insets show the investigated areas.
