Figures & data
Table 1. CNVs of ZMAT4 in controls and hematological malignancies
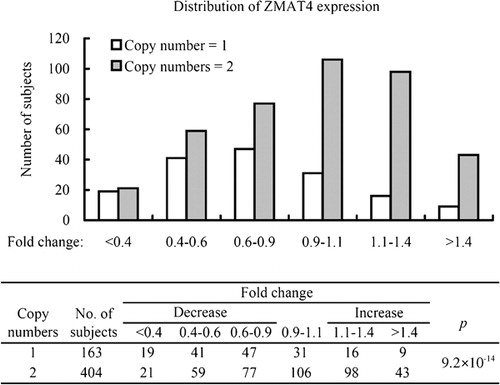
Figure 1. Expression of ZMAT4 mRNA in samples with 1 or 2 copies of DNA. The relative expression level of ZMAT4 mRNA was calculated by using the comparative C(T) method with RNAse P as the internal control. Fold change of each sample was calculated as follows: fold change = relative expression level/average expression level in the group with 2 copies of DNA. Y axis indicates the number of samples in each level of fold change. P value was calculated by chi‐square test.