Figures & data
Table 1. Clinical data of AML patients
Table 2. Sequences of primers used in PCR
Figure 1. The relative expression of CD3 genes in CD3+ T cells from AML and healthy (HI) groups.
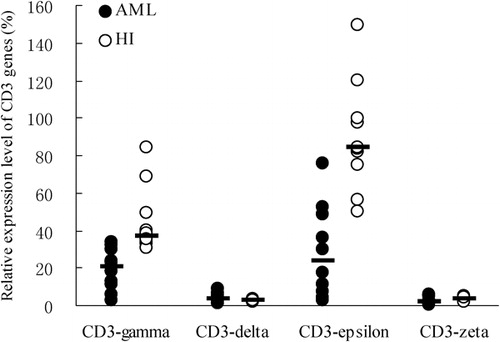
Figure 2. The pattern of CD3 gene expression levels in CD3+ T cells from 10 cases with AML and healthy individuals (HI).
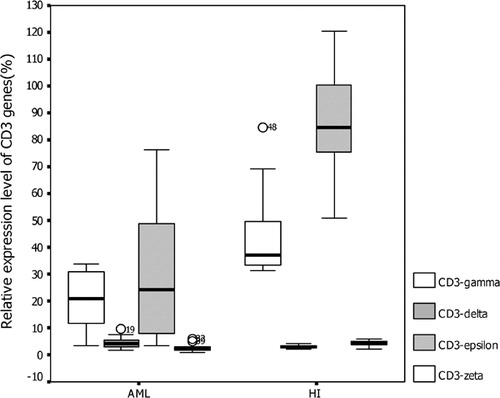
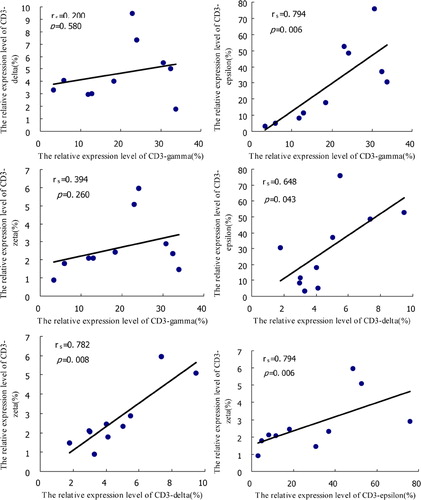
Figure 3. The correlation analysis among the relative expression levels of CD3gamma, delta, epsilon, and zeta chain genes in CD3+ T cells from AML patients.