Figures & data
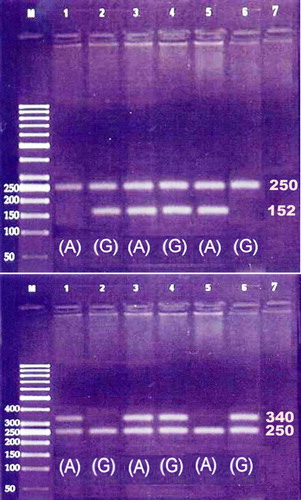
Figure 1. Amplification of FVL (above) and FII (down) using primers for mutant A alleles (lanes 1, 3, and 5) and normal G allele (lanes 2, 4, and 6) showing positive bands of size 152 bp for FVL and 340 bp for FII, whereas the 250 bp band corresponds to amplified segment of FIX serving as internal control. Lane M corresponds to DNA size marker and lane 7 to the negative control.