Figures & data
Figure 1. mRNA levels of autophagy specific genes in response to imatinib in K562 cells. 0·1, 1, and 10 nM imatinib were applied to K562 cells for 72 hours and expression levels of autophagy specific genes were determined by RT‐PCR. Expression levels of beta‐actin were detected as an internal positive control.
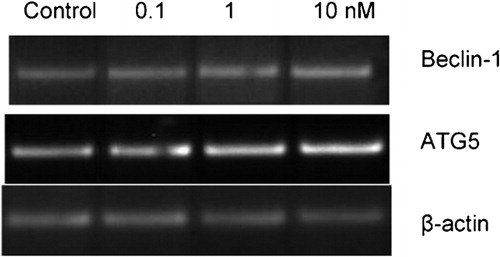
Figure 2. Fold changes in expression levels of autophagy specific genes Beclin‐1 (A) and ATG5 (B) by densitometric analysis in response to imatinib in K562 cells. Intensities of RT‐PCR products were measured by software and normalized with beta‐actin gene expression as a house‐keeping gene.
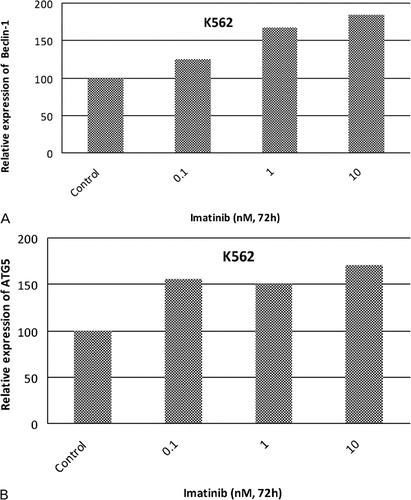
Figure 3. Fold changes in expression levels of Beclin‐1 gene by real‐time PCR in response to imatinib in K562 cells. To confirm semi‐quantitative PCR results, expression levels of Beclin‐1 gene were assessed by real‐time PCR. Relative changes in expression levels of Beclin‐1 gene were found by normalizing with beta‐actin gene.
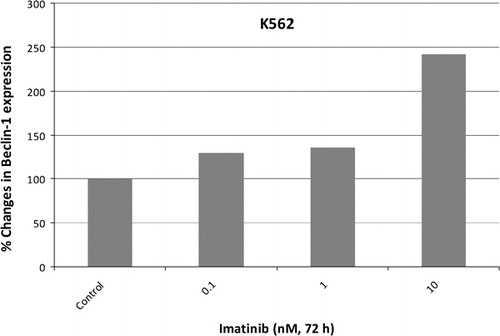
Figure 4. Protein levels of Beclin‐1 gene in response to imatinib in K562 cells. (A) Protein levels of Beclin‐1 gene in response to imatinib were determined by western blot. (B) Fold changes in protein levels were determined by densitometric analysis.
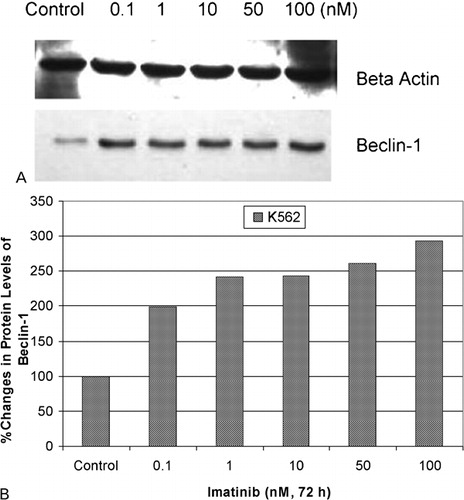
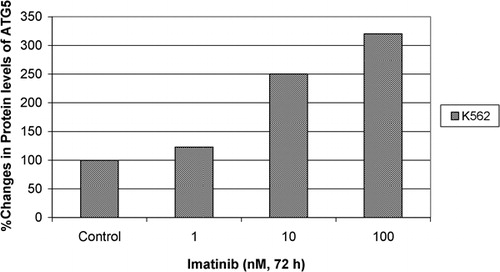
Figure 5. Protein levels of ATG5 gene in response to imatinib in K562 cells were determined by western blot and fold changes in protein levels were determined by densitometric analysis.