Figures & data
Figure 1. XIAP expression levels in K562 and K562Dox cells. Both cell lines express similar levels of XIAP protein.
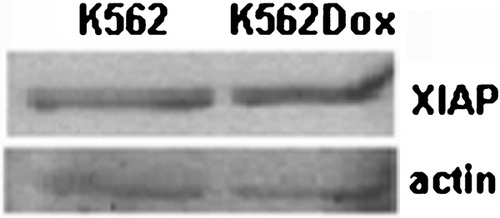
Figure 2. Characterization of the response of K562 and K562Dox cells to imatinib. Response in terms of cell viability. Results are presented as % of viable cells when compared to the blank treatment (cells treated only with the solvent of imatinib – water). Results are mean±SE of eight experiments for K562 cells and of five experiments for K562Dox cells.
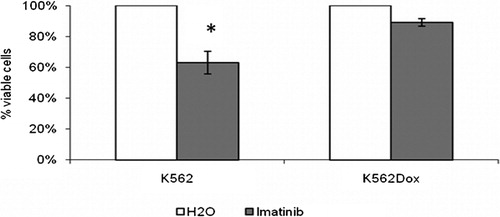
Figure 3. Downregulation of XIAP expression in K562 cells by RNAi and subsequent response to imatinib. (A) Analysis of XIAP protein expression by Western blot 24, 48, and 72 hours after transfection with control siRNA (cRNAi) or XIAP siRNAs (XIAPseq1 or XIAPseq2). (B) Effect of XIAP downregulation on sensitization of K562 cells to imatinib. Results are presented as % of the blank cells (treated with imatinib’s solvent – only water). Each group of columns refers to the treatment to which the cells were subjected before the drug was added (blank, cRNAi, XIAPseq1, and XIAPseq2). Columns in white represent the controls (treated with water); columns in grey represent cells treated with 1 μM imatinib. Results are mean±SE of four independent experiments for XIAPseq2, seven independent experiments for XIAPseq1, and eight independent experiments for blank and cRNAi. *Represents P⩽0·05 between treatments with imatinib and the respective controls treated with solvent; #represents P⩽0·05 between treatments with imatinib. (C) Dose‐response curve for imatinib in K562 cells transfected with siRNAs (cRNAi or XIAPseq1) or without transfection (blank). Results are presented as % of viable cells when compared to blank and are mean±SE of four independent experiments. (D) Programmed cell death in K562 cells treated with 1 μM imatinib following transfection with siRNAs (cRNAi or XIAPseq1) or without transfection (blank) analyzed by the TUNEL assay. Results were assessed 48 hours after imatinib was added to the cells. Results represent mean±SE of three independent experiments.
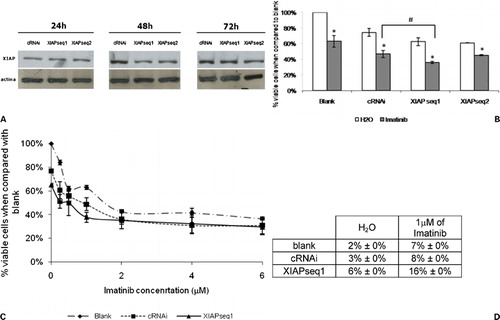
Figure 4. Downregulation of XIAP or P‐gp expression in K562Dox cells by RNAi and subsequent response to imatinib. (A) Analysis of XIAP protein expression by Western blot 24 and 48 hours after transfection with control siRNA (cRNAi) or XIAP siRNAs (XIAPseq1) and analysis of P‐gp protein expression 24 hours after transfection with control siRNA (cRNAi) or MDR siRNA (MDR‐CR). (B) Effect of XIAP downregulation on sensitization of K562Dox cells to imatinib. Results are presented as % of the blank cells (treated with imatinib’s solvent – water). Each group of columns refers to the treatment to which the cells were subjected before the drug was added (blank, cRNAi, and XIAPseq1). Columns in white represent the controls (treated with water); columns in grey represent the cells treated with 1 μM of imatinib. Results are mean±SE of five independent experiments. *Represents P⩽0·05 between treatments with imatinib and the respective controls treated with solvent; #represents P⩽0·05 between treatments with imatinib. (C) Dose‐response curve for imatinib in K562Dox cells transfected with siRNAs (cRNAi or XIAPseq1) or without transfection (blank). Results are presented as % of viable cells when compared to blank without imatinib. Results are mean±SE of three independent experiments. (D) Effect of P‐gp downregulation on sensitization of K562Dox cells to imatinib using either siRNA – MDR‐CR – or a P‐gp inhibitor – verapamil. Results are presented as % of the blank. Each group of columns refers to the treatment to which the cells were subjected before the drug was added (blank, VP, or MDR‐CR). Columns in white represent the controls (treated with water); columns in grey represent cells treated with 1 μM of imatinib. Results are mean±SE of three independent experiments. *Represents P⩽0·05 between treatments with imatinib and the respective controls treated with solvent; #represents P⩽0·05 between treatments with imatinib. (E) Programmed cell death in K562Dox cells treated with 1 μM of imatinib following transfection with siRNAs (cRNAi, XIAPseq1 or MDR‐CR) or without transfection (blank) analyzed by the TUNEL assay. Results were obtained 48 hours after imatinib was added to the cells. Results represent mean±SE of three independent experiments.
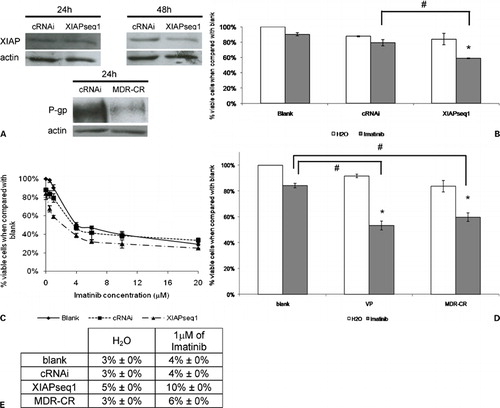
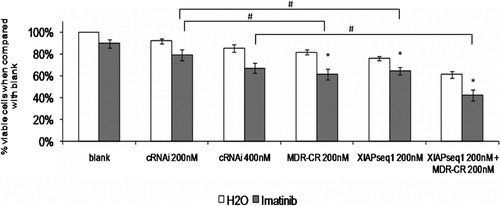
Figure 5. Effect of simultaneous XIAP and P‐gp downregulation on sensitization of K562Dox cells to imatinib. Results are presented as % of the blank cells (treated with imatinib’s solvent – water). Each group of columns refers to the treatment to which the cells were subjected before the drug was added (blank, cRNAi 200 nM, cRNAi 400 nM, MDR‐CR 200 nM, XIAPseq1 200 nM or XIAPseq1 200 nM+MDR‐CR 200 nM). Columns in white represent the controls treated with water; columns in grey represent the cells treated with 1 μM of imatinib. Results are mean±SE of five independent experiments. *Represents P⩽0·01 between treatments with imatinib and the respective controls treated with solvent; #represents P⩽0·01 between treatments with imatinib.