Figures & data
Table 1. Hematological data of the two patient groups
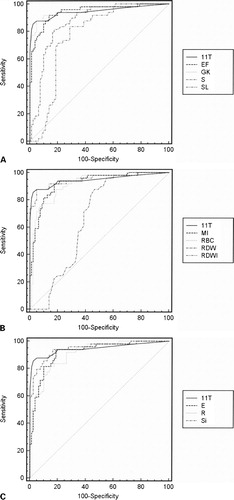
Figure 1. Receiver operative characteristic curves of different RBC indices. (A) 11T: ROC curves of our new score; EF: England and Fraser; GK: Green and King; S: Srivastava; SL: Shine and Lal. (B) 11T: ROC curves of our new score; MI: Mentzer index; RBC: red blood count; RDW: red blood distribution; RDWI: red blood distribution width index. (C) 11T: ROC curves of our new score; E: Ehsani; R: Ricerca; Si: Sirdah.