Figures & data
Table 1. Nucleotide sequences of the primers used for real-time PCR
Figure 1. Effects of RITA on human acute lymphoblastic leukemia cells. (A) NALM-6 cells were cultured in the presence of 0·5, 1, 2, 4, 8 or 10 μM RITA; 48 hours later viability of cells and the percentage of apoptotic cells was measured by MTT assay (A) and flow cytometry (B) respectively. The percentage of apoptotic cells with PS externalization after 30 hours (C). The results are expressed as mean±standard deviations (SD) of at least three independent experiments. The symbol denotes significant difference (P<0·05): * relative to cells treated with doxorubicin or RITA alone.
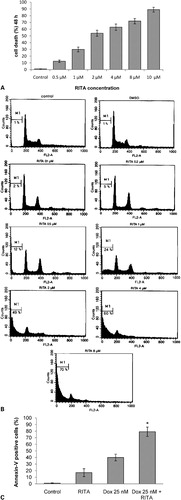
Figure 2. RITA stimulates p53 protein expression in a time-dependent fashion. NALM-6 cells were treated with RITA 2 μM and cells were harvested at different times. Total cell lysates were prepared and protein was quantified by Bradford’s assay. Equal amount of solubilized protein (40 μg) was electrophoresed on a 10% SDS-PAGE gel and transferred electrophoretically onto a nitrocellulose membrane. The blots were incubated with the anti-p53 DO-I (A) and anti-acetylated p53 (B) antibodies separately.
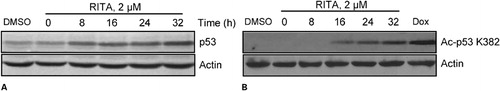
Figure 3. RITA induces p53-dependent apoptosis in NALM-6 cells. (A) NALM-6 cells were cultured with RITA 2 μM for 28 hours, and then assessed for p53 and p53 target genes mRNA expression as detailed in the Materials and Methods section. (B) The percentages of apoptotic cells with PS externalization after incubation of cells with RITA alone, RITA plus Pifithrin-alpha or RITA plus Pifithrin-mu. The results are expressed as mean±standard deviations (SD) of at least three independent experiments. The symbol denotes significant difference (P<0·05): * relative to cells treated with RITA plus Pifithrin-alpha or RITA plus Pifithrin-mu.
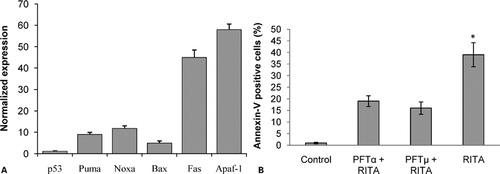
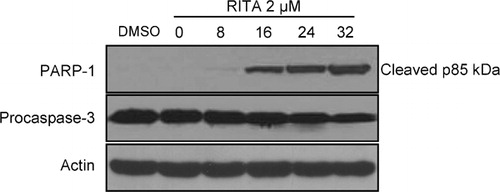
Figure 4. PARP-1 and procaspase-3 cleavage was induced in NALM-6 cells by RITA. Cells were treated as described in the legend to , harvested at the indicated times, and examined by immunoblotting with the indicated antibodies. Equal loading was verified using anti-actin antibody. One representative experiment of at least three performed is presented.