Figures & data
Table 1. Frequency distribution of serum ferritin values based on GFR changes
Figure 1. (A) Comparison of urinary NAG activity mean values between two groups. (P = 0·001). (B) The mean age comparison based on urinary NAG enzyme activity (r = 4·66, P<0·001).
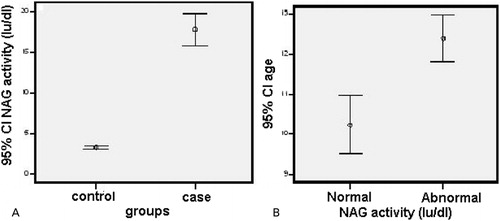
Figure 2. The correlation between urinary NAG activity and age (r = 0·351, P<0·001).
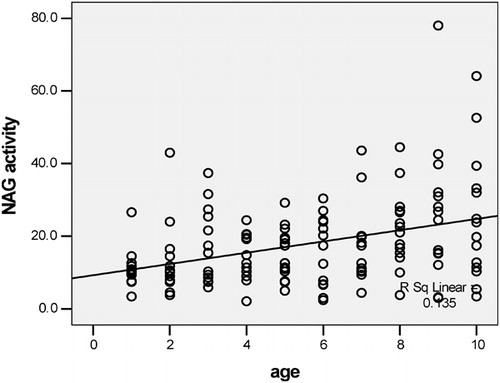
Table 2. The frequency distribution of values above normal NAG activity (IU/dl) in age groups of study
Figure 3. Correlation among serum ferritin and urinary NAG enzyme activity (r = 0·11, P = 0·19).
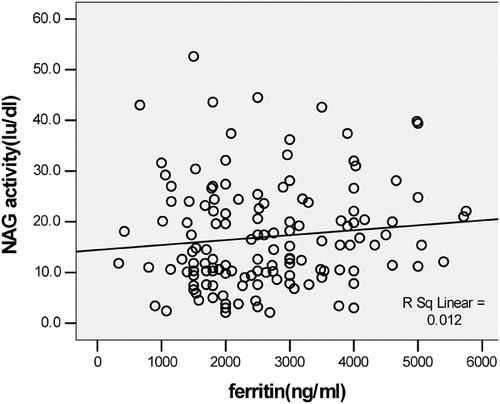
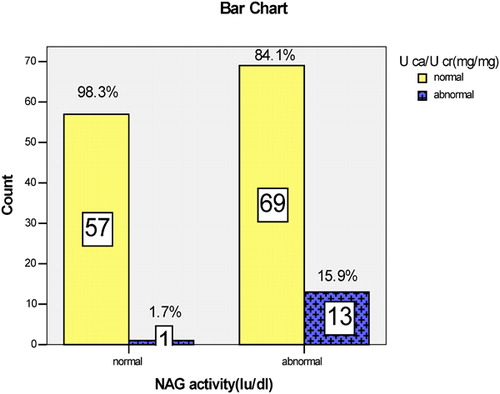
Figure 4. Frequencies of patients with hypercalciuria and urinary NAG activity.