Figures & data
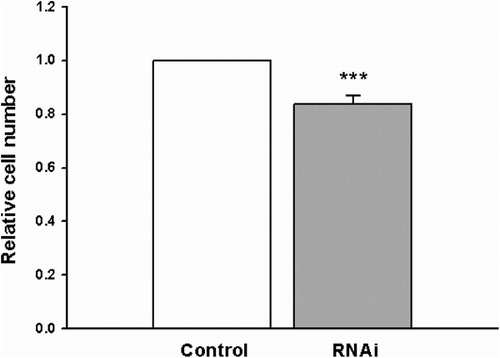
Figure 1. (A) Photomicrograph of Stat3 proteins expressed in HL-60 cells. (B) The control of secondary antibody only. Bar = 50 μm.
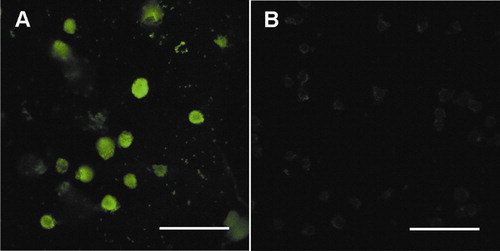
Figure 2. RT-PCR, western blot, and immunofluorescence staining showed that there was a reduction in the Stat3 expression level in the RNAi treatment group. (A) Results from RT-PCR. (B) Results from western blot. (C) Results from immunofluorescence staining. Bar = 50 μm.
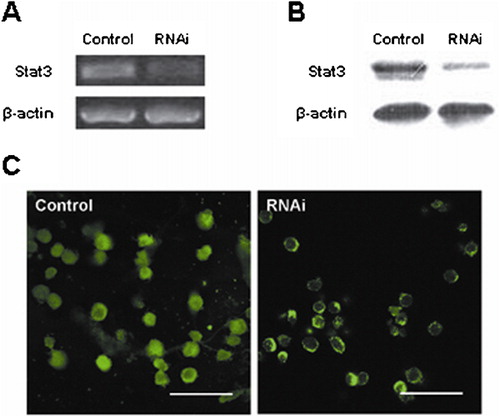
Figure 3. The effect of Stat3 RNAi on human leukemia HL-60 cell apoptosis was examined by using Annexin V assay. The statistical analysis showed that the apoptosis rate was increased after transfection with Stat3 shRNA (**P <0·01, ***P<0·001).
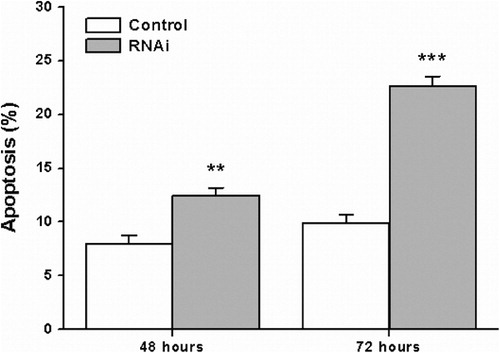
Figure 4. The effect of Stat3 RNAi on human leukemia HL-60 cell proliferation was examined by using MTS assay. The statistical analysis showed that the proliferation ability of HL-60 cells transfected with Stat3 shRNA was weakened (***P<0·001).