Figures & data
Figure 1. Characteristics of murine bone marrow-derived mesenchymal stem cells (MSCs). (A) Immunophenotype of murine bone marrow-derived MSCs. (B) MSCs morphology and capacity for differentiation. (a) Culture-expanded murine bone marrow-derived MSCs show a spindle-shaped fibroblastic morphology (magnification, ×100). (b) For adipogenic induction, the accumulated lipid vacuoles were stained with oil red O at day 14 (magnification, ×100). (c) For osteogenic induction, the cells were positive for alkaline phosphatase staining at day 14 (magnification, ×200). (d) For chondrogenic induction, the cells were positive for toluidine blue O staining at day 21 (magnification, ×100).
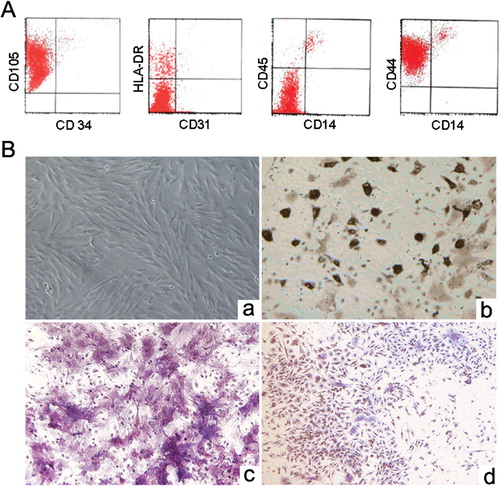
Figure 2. The effects of adi-MSCs on mixed lymphocyte cultures (MLCs). (A) Effect of adi-MSCs on lymphocyte response in primary mixed culture. Irradiated allogeneic adi- or ud-MSCs in various cell doses were added to the lymphocyte culture. Three days after coculture, cells proliferation was determined by [3H]-thymidine incorporation. (B and C) Effect of adi-MSCs on lymphocyte response in secondary mixed culture. Irradiated ‘third party’ allogeneic (B) or syngenic (C) MSCs were added to MLCs on day 0 in the designated doses per well. The number of stimulating and responding lymphocytes were kept constant in all experiments. Three days after coculture, cells proliferation was determined by [Citation3H]-thymidine incorporation. The data are expressed as mean±SD of triplicates of three separate experiments. *P<0·01, compared to the control group.
![Figure 2. The effects of adi-MSCs on mixed lymphocyte cultures (MLCs). (A) Effect of adi-MSCs on lymphocyte response in primary mixed culture. Irradiated allogeneic adi- or ud-MSCs in various cell doses were added to the lymphocyte culture. Three days after coculture, cells proliferation was determined by [3H]-thymidine incorporation. (B and C) Effect of adi-MSCs on lymphocyte response in secondary mixed culture. Irradiated ‘third party’ allogeneic (B) or syngenic (C) MSCs were added to MLCs on day 0 in the designated doses per well. The number of stimulating and responding lymphocytes were kept constant in all experiments. Three days after coculture, cells proliferation was determined by [Citation3H]-thymidine incorporation. The data are expressed as mean±SD of triplicates of three separate experiments. *P<0·01, compared to the control group.](/cms/asset/2f01a9f6-4c7e-43b7-ba58-b959c4b51447/yhem_a_11646142_f0002_b.jpg)
Figure 3. The effect of adi-MSCs on mitogen activation of lymphocytes. Lymphocytes were stimulated with ConA (5 μg/ml) or PWM (10 μg/ml) in the presence of allogeneic (A) or syngenic (B) MSCs in the indicated cell doses. After cocultured for 2 days, cells proliferation was determined by [3H]-thymidine incorporation. The data are expressed as mean±SD of triplicates of three separate experiments. *P<0·01, compared to the control group.
![Figure 3. The effect of adi-MSCs on mitogen activation of lymphocytes. Lymphocytes were stimulated with ConA (5 μg/ml) or PWM (10 μg/ml) in the presence of allogeneic (A) or syngenic (B) MSCs in the indicated cell doses. After cocultured for 2 days, cells proliferation was determined by [3H]-thymidine incorporation. The data are expressed as mean±SD of triplicates of three separate experiments. *P<0·01, compared to the control group.](/cms/asset/9ceddf46-0d73-4a34-aacb-2ce99d6b08f0/yhem_a_11646142_f0003_b.jpg)
Figure 4. Soluble factors were responsible for the stimulatory effect of adi-MSCs. Adi-MSCs (2×10⁵) were seeded onto the transwell membrane of the inner chamber, and various numbers of lymphocytes from C57BL/6 mice were cultured in the lower chamber of transwell plate in the presence of ConA (5 μg/ml) or PWM (10 μg/ml). (A) Allogeneic adi-MSCs treatment group. (B) Syngenic adi-MSCs treatment group. (C) In a parallel experiment, supernatant from MSC cultures was added into the lymphocytes cultures. After 2 days, uptake of [3H]-thymidine was measured. The data are expressed as mean±SD of triplicates of three separate experiments. MSC/R indicates the MSC-to-responder cells ratio.
![Figure 4. Soluble factors were responsible for the stimulatory effect of adi-MSCs. Adi-MSCs (2×10⁵) were seeded onto the transwell membrane of the inner chamber, and various numbers of lymphocytes from C57BL/6 mice were cultured in the lower chamber of transwell plate in the presence of ConA (5 μg/ml) or PWM (10 μg/ml). (A) Allogeneic adi-MSCs treatment group. (B) Syngenic adi-MSCs treatment group. (C) In a parallel experiment, supernatant from MSC cultures was added into the lymphocytes cultures. After 2 days, uptake of [3H]-thymidine was measured. The data are expressed as mean±SD of triplicates of three separate experiments. MSC/R indicates the MSC-to-responder cells ratio.](/cms/asset/41c404a4-dd28-4d3f-8117-ee37bba21d00/yhem_a_11646142_f0004_b.jpg)
Figure 5. The effect of the supernatant of adi-MSCs cultures on T-lymphocyte proliferation and activation. (A) T cells were cultured with ud- or adi-MSCs at a ratio of 1∶1, in the absence or presence of anti-CD3 Ab (2 μg/ml). (B) Various titrations of the supernatant of adi-MSCs were added into T-cell culture in the presence of anti-CD3 Ab. After culture for 3 days, T-cell proliferation was determined by [3H]-thymidine incorporation. (C) Activation of T cells was determined. Allogeneic T cells were incubated for 3 days with ud- and adi-MSCs, and the supernatant of adi-MSCs in the presence of anti-CD3 Ab, and stained for the surface expression of the activation maker CD25. Dashed lines indicate isotype-matched IgG antibody control staining. (D) The level of pro-inflammatory cytokines secreted by T cells. T cells were incubated for 3 days with various titrations of the supernatant of adi-MSCs in the presence of anti-CD3 Ab, and pro-inflammatory cytokines IFN-gamma and TNF-alpha in the culture were determined by ELISA. *P<0·01, compared to the control group.
![Figure 5. The effect of the supernatant of adi-MSCs cultures on T-lymphocyte proliferation and activation. (A) T cells were cultured with ud- or adi-MSCs at a ratio of 1∶1, in the absence or presence of anti-CD3 Ab (2 μg/ml). (B) Various titrations of the supernatant of adi-MSCs were added into T-cell culture in the presence of anti-CD3 Ab. After culture for 3 days, T-cell proliferation was determined by [3H]-thymidine incorporation. (C) Activation of T cells was determined. Allogeneic T cells were incubated for 3 days with ud- and adi-MSCs, and the supernatant of adi-MSCs in the presence of anti-CD3 Ab, and stained for the surface expression of the activation maker CD25. Dashed lines indicate isotype-matched IgG antibody control staining. (D) The level of pro-inflammatory cytokines secreted by T cells. T cells were incubated for 3 days with various titrations of the supernatant of adi-MSCs in the presence of anti-CD3 Ab, and pro-inflammatory cytokines IFN-gamma and TNF-alpha in the culture were determined by ELISA. *P<0·01, compared to the control group.](/cms/asset/75b95f2d-8415-4a81-a168-e8aa0614d904/yhem_a_11646142_f0005_b.jpg)
Figure 6. The effect of the supernatant of adi-MSCs cultures on B-lymphocyte proliferation, activation, and IgG secretion. (A) B cells were cultured with ud- or adi-MSCs at a ratio of 1∶1, in the absence or presence of anti-mu Ab (2 μg/ml). (B) Various titrations of the supernatant of adi-MSCs were added into B-cell culture in the presence of anti-mu Ab. After culture for 3 days, B-cell proliferation was determined by [3H]-thymidine incorporation. (C) Activation of B cells was determined. Allogeneic T cells were incubated for 3 days with ud- and adi-MSCs, and the supernatant of adi-MSCs in the presence of anti-mu Ab, and stained for the surface expression of the activation maker CD25. Dashed lines indicate isotype-matched IgG antibody control staining. (D) The level of IgG secreted by B cells. B cells were incubated for 3 days with various titrations of the supernatant of adi-MSCs in the presence of anti-mu Ab, and IgG secretion in the culture was determined by ELISA. *P<0·01, compared to the control group.
![Figure 6. The effect of the supernatant of adi-MSCs cultures on B-lymphocyte proliferation, activation, and IgG secretion. (A) B cells were cultured with ud- or adi-MSCs at a ratio of 1∶1, in the absence or presence of anti-mu Ab (2 μg/ml). (B) Various titrations of the supernatant of adi-MSCs were added into B-cell culture in the presence of anti-mu Ab. After culture for 3 days, B-cell proliferation was determined by [3H]-thymidine incorporation. (C) Activation of B cells was determined. Allogeneic T cells were incubated for 3 days with ud- and adi-MSCs, and the supernatant of adi-MSCs in the presence of anti-mu Ab, and stained for the surface expression of the activation maker CD25. Dashed lines indicate isotype-matched IgG antibody control staining. (D) The level of IgG secreted by B cells. B cells were incubated for 3 days with various titrations of the supernatant of adi-MSCs in the presence of anti-mu Ab, and IgG secretion in the culture was determined by ELISA. *P<0·01, compared to the control group.](/cms/asset/6b626fd0-f66a-4818-b637-85aa90c2a101/yhem_a_11646142_f0006_b.jpg)
Figure 7. Secreted BAFF molecule mediated the immunostimulation of adi-MSCs. (A) mRNA level of BAFF increased during adipocyte differentiation of MSCs. Data are expressed relative to the mRNA levels of beta-actin and are the mean±SD of six independent experiments. *P<0·01 versus day 0. (B) Protein level of BAFF on MSCs during adipocyte differentiation was determined by western blotting. Data are expressed relative to the protein level of GAPDH and are the mean±SD of six independent experiments. *P<0·01, versus day 0. (C) Soluble BAFF level in the supernatant of adi-MSCs. The supernatant of MSCs during adipocyte differentiation was harvested and determined for BAFF concentration by ELISA. The data are expressed as mean±SD of triplicates of three separate experiments. *P<0·01 versus day 0. (D–G) Costimulation effect of adi-MSCs or the supernatant of adi-MSCs on lymphocytes was suppressed by anti-BAFF treatment. Anti-CD3-treated T or anti-mu Ab-treated B cells were cultured with adi-MSCs at 1∶1 ratio or the supernatant of adi-MSCs in the presence of anti-BAFF mAb (10 μg/ml) for 3 days. Lymphocytes proliferation was determined by [3H]-thymidine incorporation. (F and G) The expression of activation marker CD25 in lymphocytes was reduced with anti-BAFF treatment. The data are expressed as mean±SD of triplicates of three separate experiments. *P<0·01, compared to the control cultures.
![Figure 7. Secreted BAFF molecule mediated the immunostimulation of adi-MSCs. (A) mRNA level of BAFF increased during adipocyte differentiation of MSCs. Data are expressed relative to the mRNA levels of beta-actin and are the mean±SD of six independent experiments. *P<0·01 versus day 0. (B) Protein level of BAFF on MSCs during adipocyte differentiation was determined by western blotting. Data are expressed relative to the protein level of GAPDH and are the mean±SD of six independent experiments. *P<0·01, versus day 0. (C) Soluble BAFF level in the supernatant of adi-MSCs. The supernatant of MSCs during adipocyte differentiation was harvested and determined for BAFF concentration by ELISA. The data are expressed as mean±SD of triplicates of three separate experiments. *P<0·01 versus day 0. (D–G) Costimulation effect of adi-MSCs or the supernatant of adi-MSCs on lymphocytes was suppressed by anti-BAFF treatment. Anti-CD3-treated T or anti-mu Ab-treated B cells were cultured with adi-MSCs at 1∶1 ratio or the supernatant of adi-MSCs in the presence of anti-BAFF mAb (10 μg/ml) for 3 days. Lymphocytes proliferation was determined by [3H]-thymidine incorporation. (F and G) The expression of activation marker CD25 in lymphocytes was reduced with anti-BAFF treatment. The data are expressed as mean±SD of triplicates of three separate experiments. *P<0·01, compared to the control cultures.](/cms/asset/ceef8873-52dd-429e-9708-e95c3523af15/yhem_a_11646142_f0007_b.jpg)